This article series is a deep dive into all of the metrics that our fantastic data collection team has procured from charting every single NFL game over the last two years.
We are thrilled to offer access to our entire hub of tools to you for $200 ($50!!) for the 2023 season. The Fantasy Points Data Suite will be your go-to for NFL research – forever. Our fast filtering system displays hundreds of data points in seconds, all quickly digested into your preferred fantasy scoring system.
With the last two years of Fantasy Points Data at my disposal, I studied which stats matter the most at each position regarding fantasy football. To do this, I ran correlation tests across hundreds of metrics – seeking statistical signals.
What We’re Studying
For this study, we only want to look at fantasy-relevant wide receivers. To make sure part-time players don’t skew the numbers, only WRs with at least 150 routes run and at least four games played were included.
This data spans the last two seasons (2021-22) — The total sample size = 271 WRs.
Fantasy scoring is Half PPR.
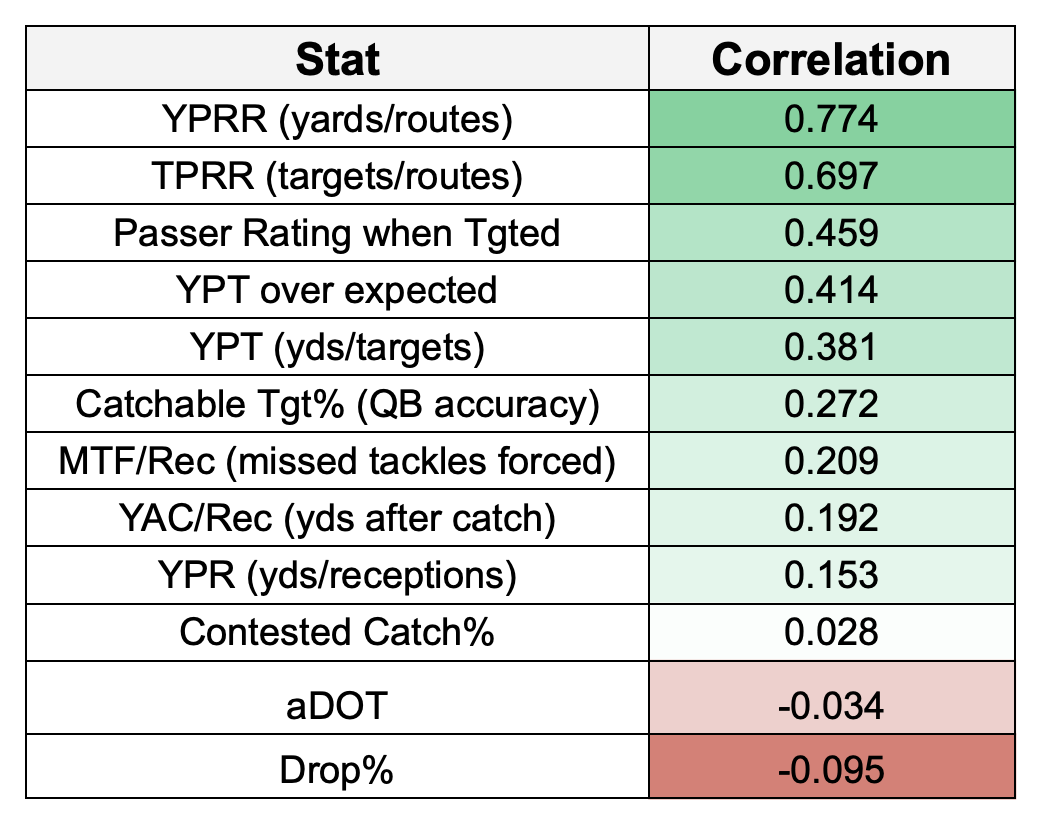
All correlation data is ranked by strongest (+1 | perfectly positive), weakest (0.0 | no correlation), to negative (-1 | perfectly negative).
Volume Receiving Stats
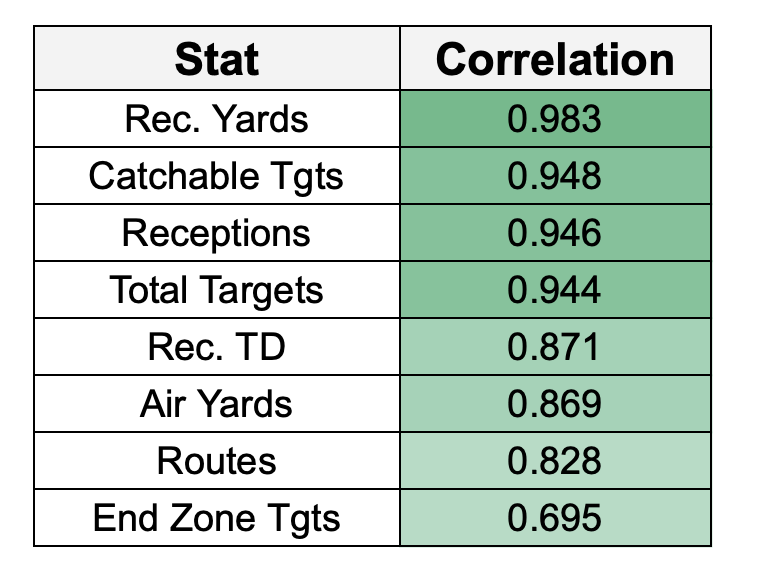
After total receiving yards, look how closely targets track fantasy points. At the end of the day, volume is what we’re trying to predict. If you can project targets, you can project fantasy points.
Ideally, we want fantasy squads filled with receivers that have the ability to either lead their team in targets (and by a significant margin) or strong secondary receivers on extremely pass-heavy offenses.
The best way to think of this from a top-down approach is to weigh the total projected passing volume for a team like the Chargers compared to a run-heavy offense like the Bears. While Mike Williams will likely end the season with a lower target share than DJ Moore, Williams can more than make it up because of total volume.
With Fantasy Points Data, we have the ability to take the passing volume conversation a step further through the lens of Catchable Throws – or in this instance, Catchable Targets.
Targets are earned, and we are chasing them. However, not all targets are created equal. Continuing our Williams vs. Moore example – Justin Herbert will not only attempt more passes this season (more volume!), but he will be more accurate than Justin Fields.
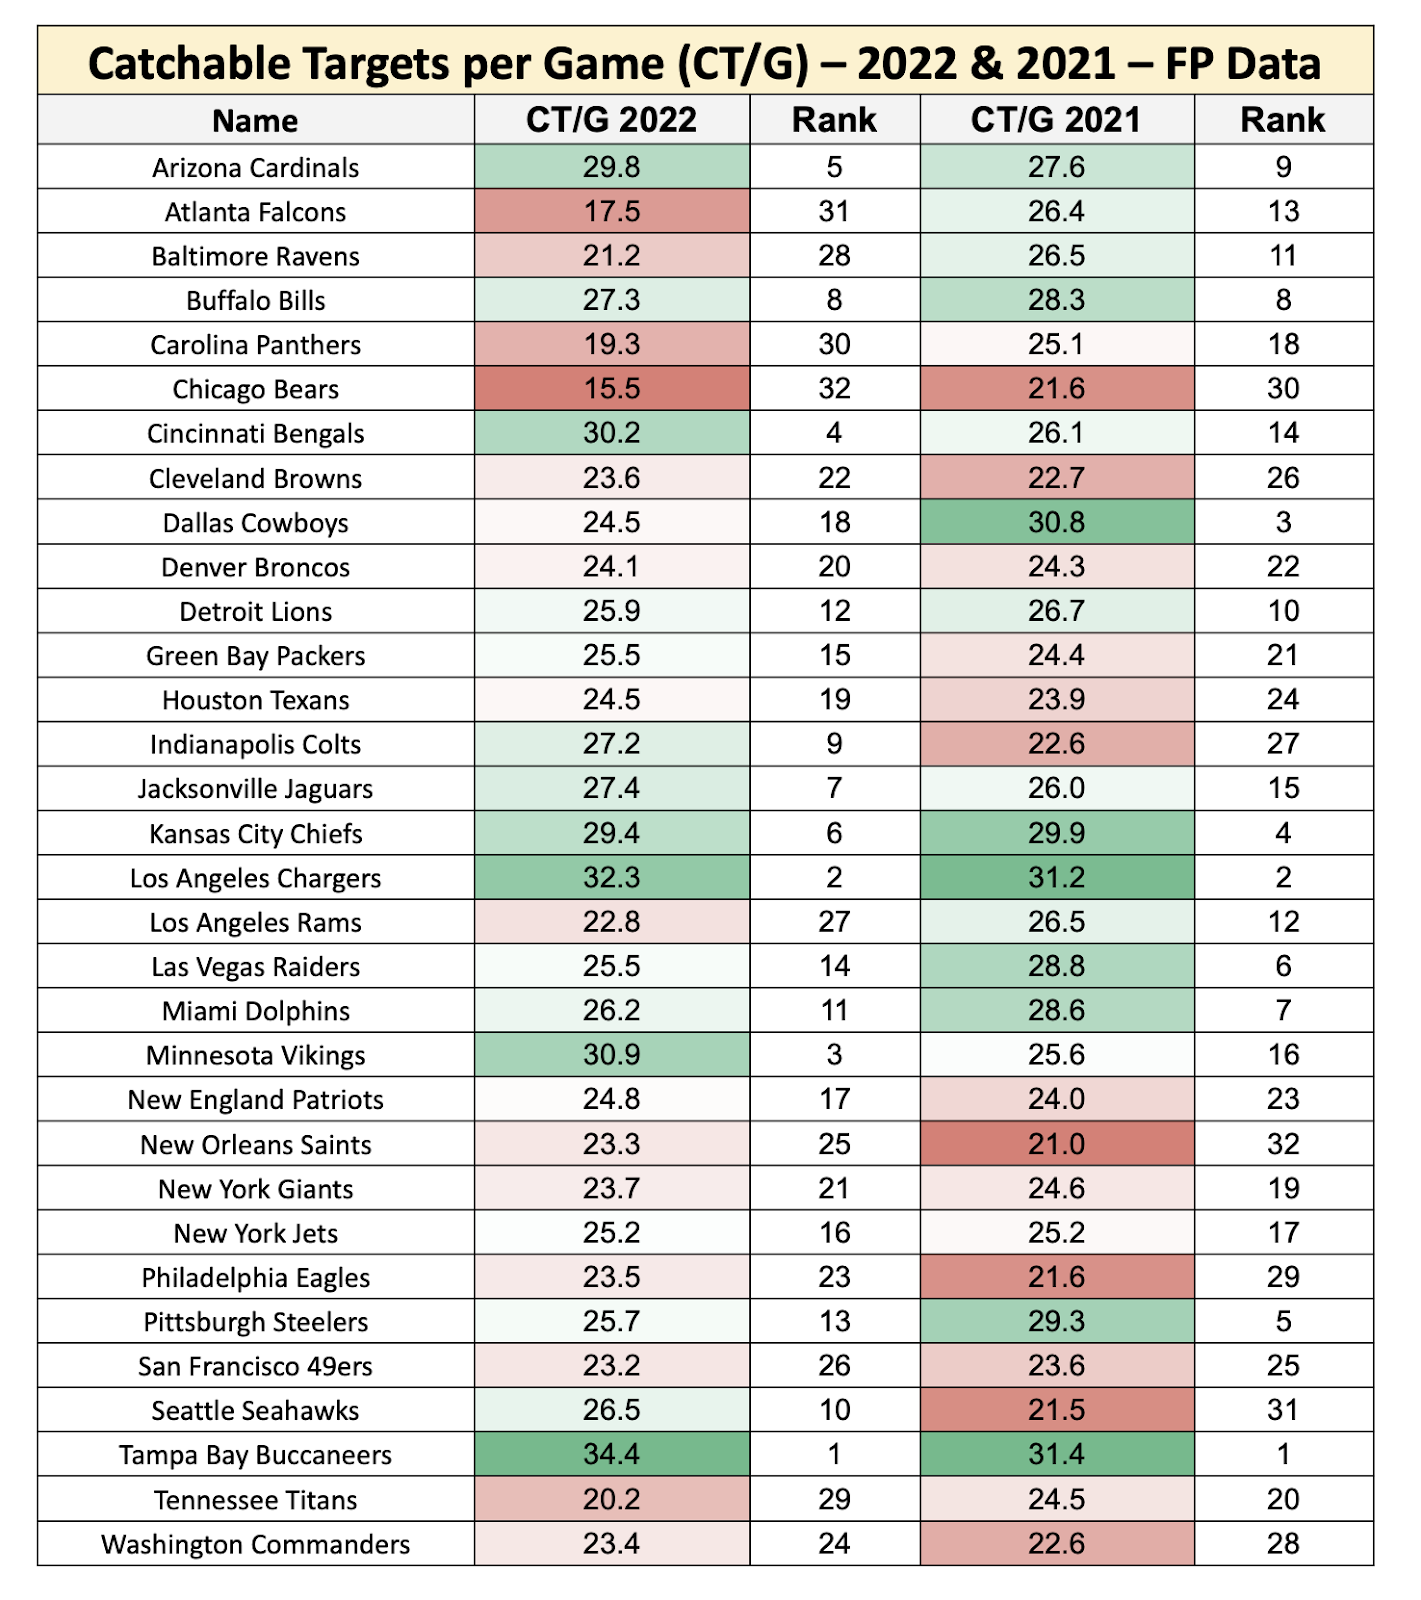
Here are the last two years of team-by-team leaders in catchable throws (targets) per game, sorted by last season.
Catchable Targets per Game – by team
Before we go through some takeaways, note that total catchable targets per game and early-down pass rate have a very tight relationship (0.848 | significant positive correlation).
So, we’re capturing team-level volume that tracks very closely to pass rate, and it factors in QB accuracy! Great stat.
Tampa Bay Buccaneers
Life is about to get a whole lot harder for Bucs receivers Mike Evans and Chris Godwin. The GOAT may have lost a little zip, but he was still accurate last season, ranking ninth in catchable throw rate (78.2%). The 44-year-old Tom Brady gave his WRs far more accurate passes than Baker Mayfield, who ranked fourth-from-last in catchable throws (72.8%) last season.
And, if you’re curious, Mayfield ranked second-from-last in the 2021 season (72% catchable throws).
L.A. Chargers
Justin Herbert has thrown a ridiculous 1,371 passes (40.3 per game) over the last two seasons, trailing only Brady (42.7) in this span. New OC Kellen Moore won’t slow down the pace, but we will absolutely see more aggression to push the ball downfield this season.
Last year under their old OC Joe Lombardi, just 8.7% of Herbert’s passes traveled 20 or more yards in air – which was the fourth-lowest rate among QBs. With their weapons, we will gladly take riskier (and by nature, less accurate) downfield shots from Herbert in exchange for fewer checkdowns.
For comparison, Herbert’s average depth of target was a pitiful 6.7 yards, while former Cowboys-OC Moore’s QB Dak Prescott had an aDOT of 8.5 yards downfield.
We will really see the spike on early downs.
Herbert’s average depth of target on first and second downs was just 5.9 yards last season! 5.9! That was 56th-of-57 qualifying QBs. Only Colt McCoy (5.7 aDOT on early downs) was lower. Prescott’s early-down aDOT was a much more normal 7.4 yards.
Unlike Lombardi, this new offense should not be afraid to throw the ball past the sticks. Wheels up.
Minnesota Vikings
The Vikings jump from 16th to 4th in catchable throws per game was fueled by volume. Don’t get me wrong, Kirk Cousins’ accuracy (77.4% catchable throw rate | 15th-best) was good once again. The scheme change from new HC Kevin O’Connell just drove this.
Here is where the Vikings ranked in pass rate in all key game situations last season:
4th in pass rate when the game is within a score (65%)
2nd in pass rate when trailing (70%)
6th in pass rate when leading (64%)
6th in pass rate over expected (+5.5%)
Cincinnati Bengals
Similarly to the Vikings, the Bengals also opened up their passing game last season. It also helps that the Bengals have the NFL’s version of Arthur Morgan at QB – nothing but Dead Eyes. Joe Burrow ranked third-best in catchable throw rate (79%) and third-lowest in off-target throws (12%) last season.
The Bengals ranked top-5 in pass rate in all key situations last year:
- 2nd in pass rate when the game is within a score (67%)
- 5th in pass rate when trailing (66%)
- 1st in pass rate when leading (68%)
- 3rd in pass rate over expected (+9.4%)
More on Burrow, Ja’Marr Chase, and Tee Higgins in a bit.
Atlanta Falcons
Here we see what extreme low passing volume combined with erratic QB play looks like in this table.
Not only were the Falcons bottom-3 in pass rate in all situations, both Marcus Mariota and Desmond Ridder had accuracy problems. Our data collection team tagged Mariota as off-target on 20.7% of his 300 attempts, while Ridder was last in off-target throws (27.8% on 115 attempts).
Remember that in his four starts, Ridder did not play with Kyle Pitts, and Cordarrelle Patterson was his WR2. Pitts coming back will allow Drake London to move back to his normal outside role, and they have Mack Hollins and Jonnu Smith as upgraded WR2/TE2 options. Also, some RB named Bijan Robinson is there. I hear he’s OK at football.
There is hope.
There are two different sample sizes at play here, but the Falcons were 59% run-heavy on early downs (red-zone plays excluded) in Marcus Mariota’s 13 starts, easily leading the league.
That shifted to 52% run-heavy in Ridder’s four starts – which still would have ranked fourth-highest over the full season – but it also provides a real glimmer of hope that the pass game volume rebounds.
The Falcons' early-down pass rate increased by 7% when Ridder started, and their overall passing volume increased as a result. Atlanta averaged 25.3 pass plays per game with Mariota, but that bumped up to a more respectable 31.1 pass plays per game with Ridder.
Baltimore Ravens
The Ravens’ passing volume will spike upwards this season with the switch from old OC Greg Roman to OC Todd Monken – the big question is just by how much. Just for context, another reason the Ravens' catchable target volume fell off a cliff last season was because Lamar Jackson missed six games. Lamar’s catchable throw rate was 74.5%, while backup QB Tyler Huntley was at 71.5%.
Catchable Targets per Game – by player
Crucially, we can also look at this at a player level in the Fantasy Points Data Suite.
Note that catchable targets (0.948 correlation) have the same exact, strong statistical relationship to fantasy points as total targets (0.944).
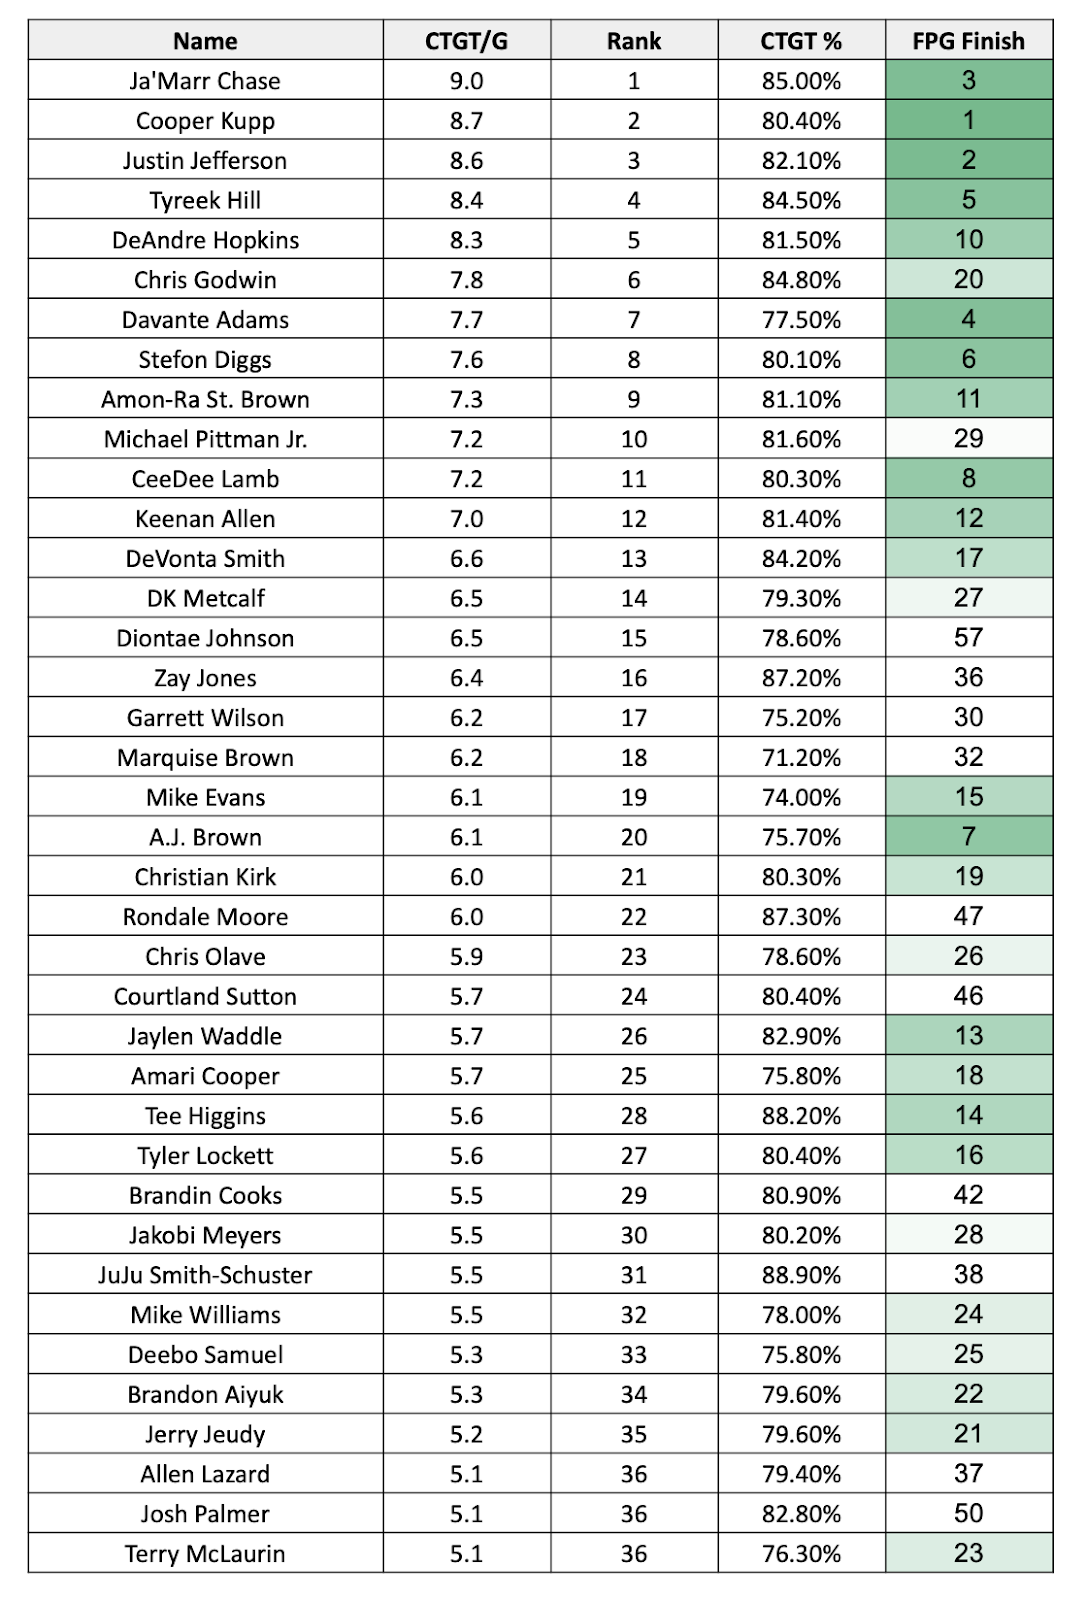
Here are the top-36 WRs (and ties) sorted by catchable targets per game from last season:
The middle column (CTGT%) is the percentage of the receivers total targets that were catchable.
Let’s go through some takeaways…
Ja’Marr Chase + Tee Higgins
Well, here’s your case for Chase as the WR1 – elite talent + volume + chemistry with Joe Burrow. A whopping 85% of Chase’s targets were catchable last season… and that was only outdone by Tee Higgins (88.2%).
In fact, Higgins (4th) and Chase (8th) finished top-8 in catchable target% among the 81 WRs with at least 50 targets last season. If you’re curious, Tyler Boyd wasn’t too far behind with a catchable target rate at 79.7% (37th-of-81).
Also note that Chase played through a brutal labrum (hip) injury that caused him to miss five games mid-season, while his teammate Tee Higgins (concussion/ankle sprain/hamstring strain) got unlucky with three separate injuries.
Chase and Higgins are healthy now. Everyone is looking to get paid. Burrow is in for a career-best year (presuming that calf injury doesn’t linger, of course).
Ja'Marr Chase and Tee Higgins have played in 27 career games together
— Graham Barfield (@GrahamBarfield) July 11, 2023
Chase is the clear WR1, but Higgins has held his own
Implied finish = how their past production stacks up on a fantasy points per game basis pic.twitter.com/qf7xXPyc8z
A.J. Brown + DeVonta Smith
The slight gap between Smith (6.6) and Brown’s (6.1) catchable targets comes down to their difference in target depth. Smith saw shallower looks (9.9 aDOT) compared to Brown (12.8), mainly because Smith got triple the ratio of designed plays/screens compared to Brown (15% to 5%).
Brown had the more valuable role in fantasy because his targets were deeper downfield, and he got more end-zone targets (11 to Smith’s 7), but make no mistake: This duo is a true WR1A/B situation.
Brown was Jalen Hurts’ first read most of the time (32.1%), but Smith was not too far behind (29%).
We can also bank on more passing volume for the Eagles as a whole. This is a minor edge, but Philadelphia attempted just 94 passes in the 4th quarter of games last year – which was nine fewer 4Q passes than Atlanta (103) attempted. Unreal.
The Eagles held a double-digit lead at some point during the 4th quarter in 11-of-17 games last year, tied with the 49ers for most in the league. That will regress some this season.
Diontae Johnson
Johnson is the second-most obvious 2023 progression to the mean candidate besides Kyle Pitts. It’s insane that Diontae ranked 15th in catchable targets per game but 57th in fantasy points, but that’s what happens when you have zero TD luck (H/T Scott Barrett’s expected TD work).
Michael Pittman
For my money, Pittman is one of the toughest receivers to project in fantasy this season. Let’s start with the good news.
While he got a lot of volume last season, it came attached with a huge dip in his average depth of target. Pittman’s aDOT dipped from 9.8 yards in 2021 down to a lowly 6.9 yards last season.
Matt Ryan just didn’t have any zip left on his ball and Pittman’s usage suffered because of it. Last year, just 11% of Pittman’s targets came on four deep routes – Go/Post/Corner/Deep Cross. Two seasons ago, 25% of Pittman’s targets came on those four same routes.
That will change significantly this coming season with Anthony Richardson under center. In his final year at Florida, Richardson’s average depth of target was a monster 11.5 yards downfield as nearly 40% of his total passing yardage came from the deep ball (20+ yard throws).
The downside for Pittman is that the Colts' passing volume is expected to drop off a cliff. Last year, the Colts were 8th in pass plays per game (39.1). There is no way new HC Shane Steichen will ask Richardson to come close to that number in his rookie season.
Terry McLaurin
Once again, McLaurin dealt with some of the league’s worst quarterback play as 76.3% of his targets were catchable – the fourth-lowest rate among the top-24 scorers in fantasy points per game last season.
His teammate Jahan Dotson suffered even worse. Just 71.2% of his targets were catchable, which ranked 74th of 81 WRs with at least 50 targets.
The hope here is that some combination of Sam Howell + Jacoby Brissett under Eric Bieniemy’s tutelage collectively becomes the best QB play of McLaurin’s career. Howell certainly isn’t afraid to drive the ball downfield and has the pocket awareness and mobility to extend plays. Meanwhile, Brissett has delivered a catchable ball on 77.4% and 79.6% of his throws over the last two seasons. I’m optimistic.
Jaguars WRs
Note that Zay Jones (6.4 | 16th) and Christian Kirk (6.1) | 21st) were both top-24, respectively, in catchable targets per game.
Trevor Lawrence was absolutely dealing last season in his first year under HC Doug Pederson and was back to looking like the Clemson star that made him the #1 overall pick by the end of the year.
The thing is, there is plenty of room for the Jaguars passing attack to grow. And I’m not even necessarily talking about Calvin Ridley’s addition.
Jacksonville ranked just 11th in pass plays per game (36.7) last season, so there is plenty of room for growth volume-wise. Looking across all game situations, the Jags ranked…
14th in early down pass rate (61%)
14th in pass rate when leading (58%)
9th in pass rate when trailing (65%)
9th in pass rate over expectation (+2.3%)
It’s logical to project another step forward from Lawrence, which could lead to a bigger spike in volume, too. If Lawrence has a true 30+ TDs and 4300+ yards breakout, at least two of the Jags’ receivers will finish top-24 in fantasy.
Garrett Wilson
Before we move on from this section, I’ll leave you with this note…
In his eight starts with Zach Wilson at quarterback, Wilson averaged just 4.8 catchable targets per game (which would have ranked 41st behind Drake London (5.0 CTGT per game).
In his eight games with either Joe Flacco or Mike White, Wilson’s catchable targets leaped to 8.0 per game – which would have ranked fifth-most behind only DeAndre Hopkins (8.3), Tyreek Hill (8.4), Justin Jefferson (8.6), Cooper Kupp (8.7), and Ja’Marr Chase (9.0).
Wilson was an elite target earner last season and produced like a future fantasy WR1 when he got a modicum of good QB play. Which leads us to this season.
Count me in the camp that believes Aaron Rodgers is not washed.
Last year, our data collection team charted Rodgers with a highly accurate, near-perfect pass on 45.3% of his throws of 10+ yards downfield. That ranked fourth-best. Rodgers’ receivers in Green Bay did him no favors on these throws, dropping 8.2% of would-be receptions (second-highest rate).
Rodgers lost 295 passing yards from those drops (third-most).
The Jets 2022 QB room? Well, they were 32nd (Wilson, 26.2%), 34th (White, 23.3%), and Flacco 35th (22.7%) in highly accurate, near-perfect passes on throws of 10+ yards.
Rodgers could still spin it last season, and if that carries over into 2023, the hype around Wilson will be 1000% justified.
Usage Receiving Stats
Expected Fantasy Points (XFP)
XFP is Expected Fantasy Points, which is Scott Barrett’s brainchild. XFP measures the number of fantasy points you’d expect a wide receiver to score on a per-play basis – and that number is based on down and distance, yards from the goal line, and average depth of target. It’s the stat to use to identify positive or negative regression candidates.
First Read Targets
First Read targets and the data collection behind it was an idea from Brett Whitefield as a way to track where the quarterback’s first read is by play design.
Our Ryan Heath expanded on first reads and everything behind the stat in this masterful article.
Threat Rate
Threat rate is another way to define target share. These are targets divided by all “aimed passes” – which disregards throwaways, spikes, etc.
Route Share (Route%)
After targets – specifically catchable targets – the second-best opportunity stat are routes and route share.
The “share” is the percentage of routes the receiver ran on pass plays in games they were active.
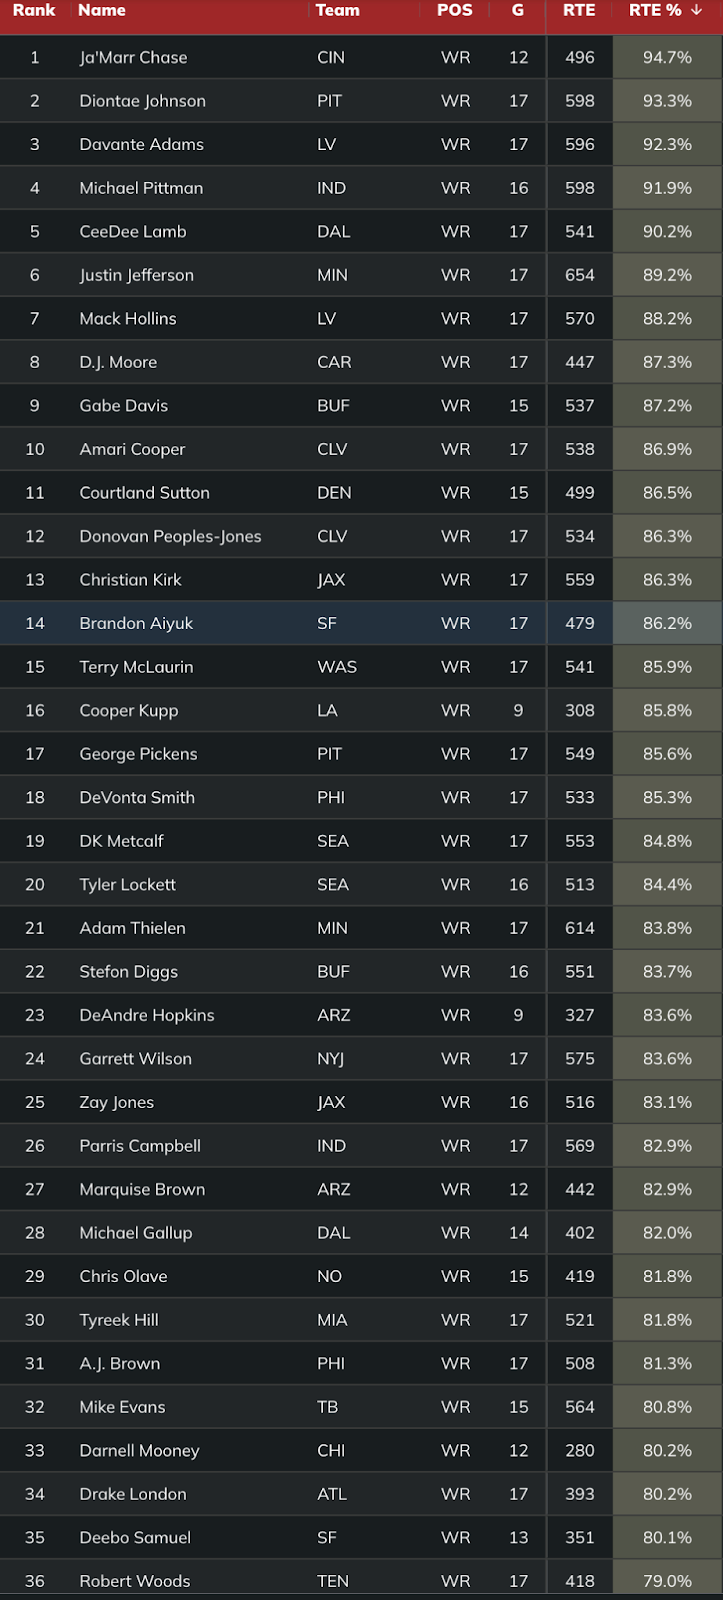
This differs from snap share in two key ways – 1) Our data collection team is meticulous about charting actual routes run. Pass plays where a receiver blocked on a screen pass is not a route. 2) Route share is calculated by dividing routes by team pass dropbacks. Here are the top-36 WRs by route share last season:
The Gabe Davis Conundrum
While routes (and route share) are behind target-related stats from a correlation standpoint, there is still a ton of value in knowing exactly who is on the field all of the time. There are only a handful of every-down WRs that never come off of the field, and they are largely the best in the game.
That’s until you get the WR9 in route share last season – Gabe Davis.
On the one hand, we were right in the sense that Davis would never come off of the field as the Bills' X-receiver.
On the other hand, Davis’ ability to earn targets on those routes is in question.
So, while Gabe ranked 9th in route share – he ranked tied for 63rd with Colts rookie WR Alec Pierce in targets per route run (TPRR). Here’s the thing, though. Davis was pretty good against zone coverage last season but really struggled against man coverage.
Against all zone coverages, Davis’ TPRR was 0.20, and he averaged 1.78 yards per route run (YPRR). A whopping 69.1% of Davis’ total first read targets came against zone.
On the flipside, Davis’ TPRR vs. man coverage dipped to a lowly 0.12, and he averaged just 1.28 YPRR.
After a high ankle sprain early in the season, it is possible that Davis lost some of his burst and couldn’t separate against man coverage as well as he previously would have. If that’s the case, Davis’ stronger numbers against zone are just enough to keep the light on for him as a WR3 type here.
Air Yards Share (AY Share%)
Air yards are a bit of a controversial and often misunderstood stat.
The wrong way to go about it is to just look at average depth of target (air yards divided by targets) and make broad assumptions about what a receiver can or can not do as a route runner.
The right way to go about it is to look at air yards as a descriptive opportunity stat to use after targets and routes. XFP (expected fantasy points) captures air yards as a part of the equation, and it’s the best catch-all lens for targets and air yards (opportunity).
Last season, the top two wide receivers in team share of air yards were both Cardinals:
WR1 DeAndre Hopkins (54.7% AY Share)
WR2 Marquise Brown (50.7%)***
*** in games that Hopkins missed (Weeks 1-6)
Hollywood also averaged 10.3 targets per game (fourth-most among WRs) in his first six games before another foot injury harpooned his season. Brown has WR1-level of opportunity coming his way this season.
Designed Targets
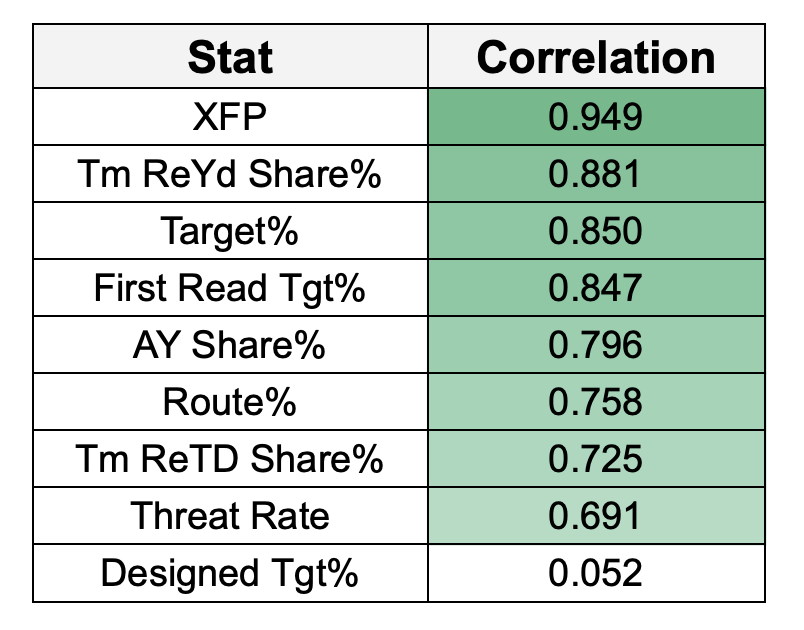
Designed targets are screens or all quick throws meant to get the ball in the receiver's hands quickly. While they have basically no relationship to fantasy points, because screens happen relatively infrequently, it can be used as a great descriptive stat to see whose targets may have been inflated by screens.
Deebo Samuel (30%) and Skyy Moore (28%) led all wideouts in designed target rate last season, followed by Quez Watkins (27%), Darnell Mooney (25%), and Chris Godwin (25%).
Our Chris Wecht believes the OC change from Byron Leftwich to Dave Canales will impact Godwin from a designed target perspective.
Why I'm no longer drafting Chris Godwin in best ball using stats you can only find using @FantasyPtsData
— Chris Wecht (@ChrisWechtFF) July 17, 2023
Godwin had a 20.4% TGT Share ranking 20th overall but he had 25.4% of his targets come on designed throws which ranked 5th pic.twitter.com/wMDbGY1okW
Efficiency Receiving Stats
So, remember how we noted in the QB and RB breakdown articles that there was not a great catch-all efficiency metric for passers and runners?
Well, that’s not true for wide receivers.
Yards per route run (YPRR)
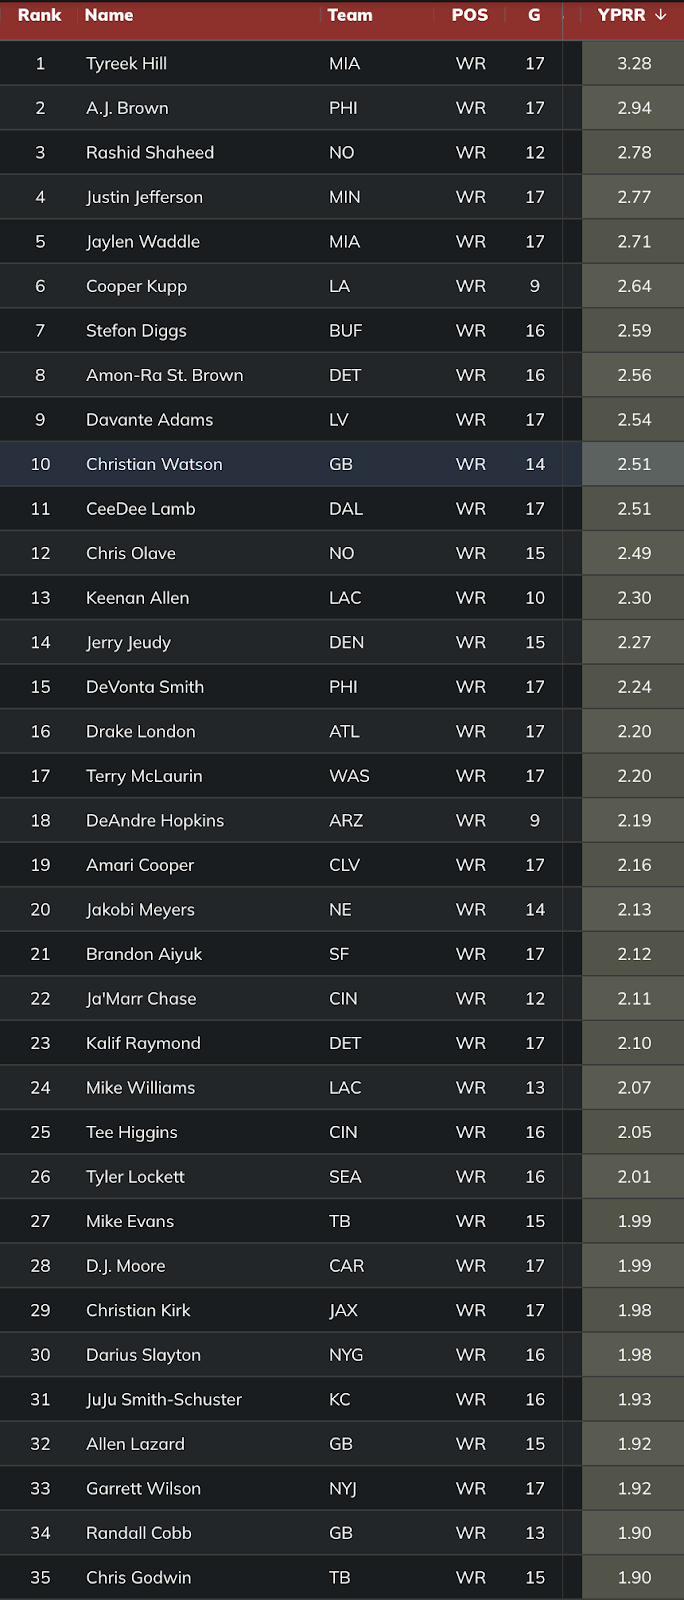
YPRR remains the GOAT efficiency stat for wide receivers. We have been using this stat for years to identify studs before they break out and to fade players that may be breaking down.
In the Data Suite, you can split out all receiver stats by coverage scheme, which is a huge piece of context that I will save for a future article.
In the meantime, here are the top-35 WRs in YPRR last season:
Targets per route run (TPRR)
TPRR has a high correlation with fantasy points, but note that it’s a worse statistic than target share or first-read target share.
Targets per route run can be used to better understand oddities at receiver (like Gabe Davis’ man vs. zone splits).
Most importantly, though, TPRR is a pretty sticky stat with a 0.65 correlation year-over-year. Previous season TPRR has an r-squared value of 0.36 to the next season’s targets.
I’m looking at you, Deebo Samuel.
Targets per route run in the 5 games that Brock Purdy + Christian McCaffrey + Deebo Samuel played together (@FantasyPtsData):
— Graham Barfield (@GrahamBarfield) July 20, 2023
1. Samuel (0.26)
2. CMC (0.23)
3. Brandon Aiyuk (0.19)
4. George Kittle (0.19)
Deebo was also WR1 first read target share (25%), followed by Aiyuk (20%)
Catchable Target%
Note this is different from total catchable targets, which is a measure of volume.
Catchable target rate is the percentage of the receiver's total targets that were catchable.
As you look closer at the receivers that saw more volume, there is more signal here. Among receivers that saw at least 75 targets over the last two seasons, catchable target rate correlated to FP at 0.364.
Catchable target rate is decently sticky for wide receivers (0.41), meaning that there is some correlation year-over-year (of course, that is very much a QB stat as well).
Missed tackles forced and yards after the catch
We see that there is some weak, positive correlation between MTF and YAC and fantasy points. Still, it pales in comparison to YPRR and TPRR in terms of its predictive power.
At wide receiver, missed tackles and yards after the catch are a function of skill and scheme. If you’re a deep-shot receiver who thrives off of contested catches, you’re naturally going to average fewer yards after the catch because there are more defenders around you.
We typically see players with shallower average target depth pop in both of these stats – like slot receivers.
Contested Catches
Finally, note that there is basically no value in using contested catches in your fantasy analysis. Brett Whitefield and Chris Wecht have a few ideas on how to make this a better stat, though. More later!


