
Fantasy Points Data is home to the best tool shed for NFL data available on the internet. Seriously, if you spend more than 3 minutes there, you will see exactly what I’m talking about.
The greatest part is that we are just scratching the surface of FPD’s power. Our goal is to create tools and stats not just to view – but to understand and implement in your own research.
So, if you’re new to FPD – welcome! Your first question is probably, “How do I apply this to my fantasy teams?”
Glad that you asked!
In this article, we will walk through the top-10 most important stats to know, understand, and utilize. Consider these the most important metrics to use on a weekly basis to help analyze fantasy lineups, place wagers, and set DFS rosters.
1. Expected Fantasy Points (XFP)
XFP is Expected Fantasy Points, which is Scott Barrett’s brainchild.
XFP measures the number of fantasy points you’d expect a player to score on a per-play basis – and that number is based on down and distance, yards from the goal line, and average depth of target. It’s the stat to use to identify positive or negative regression candidates.
XFP can be used across all positions, but it’s easily my favorite usage stat to analyze for running backs.
Generally speaking, a target is worth 2.5x more fantasy points than a carry in PPR scoring, while that figure is 2x in Half-PPR leagues. XFP accounts for the value of targets and appropriately weighs them. Check it out below.
Last year, the XFP per game leaders in Half PPR were: 1. Christian McCaffrey (21.1) – SF games only
2. Austin Ekeler (19.5)
3. Joe Mixon (17.9)
4. Josh Jacobs (17.7)
5. Saquon Barkley (17.0)
6. Derrick Henry (16.9)
7. Jonathan Taylor (15.6)
8. Javonte Williams (15.6)
9. Rhamondre Stevenson (15.5)
10. Alvin Kamara (15.4)
Joe Mixon is probably the biggest surprise on this list. On the one hand, he looks like a good buy-low based on his role. Mixon finished as the RB8 in FPG (15.0) last season, well behind his XFP (17.9). On the other hand, Mixon under-performing according to XFP could be a sign of skill regression as opposed to bad luck…
Joe Mixon still has a great TD upside for fantasy. Volume > everything else. But there are some major red flags in his profile.
— Graham Barfield (@GrahamBarfield) July 15, 2023
His metrics last season via @FantasyPtsData:
* 33rd-of-33 RBs in missed tackles forced per carry (0.086)
* 32nd in YPC on zone-concept runs (2.99)
*…
We’re going to find out quickly this season whether or not Mixon still has it. The Bengals are favored in six-straight games before their Week 7 bye, and Mixon has shown pretty wide splits in terms of his scoring in wins vs. losses.
Over the last three seasons, Mixon has averaged 18.3 Half-PPR fantasy points per game in wins vs. 12.3 FPG in losses. That’s usually the difference between the ~RB4 and ~RB20 in scoring.
Fantasy Points Data Suite
Go to Bell Cow Report > sort by XFP
2. Snap Splits
In my most important stat series from this summer, I analyzed which stats correlate best to fantasy points across all positions. For running backs specifically, we noted that snaps correlate best to fantasy points (after XFP). This data measures how well each stat (on the left-hand column) correlates with fantasy points (value in the right-hand column).
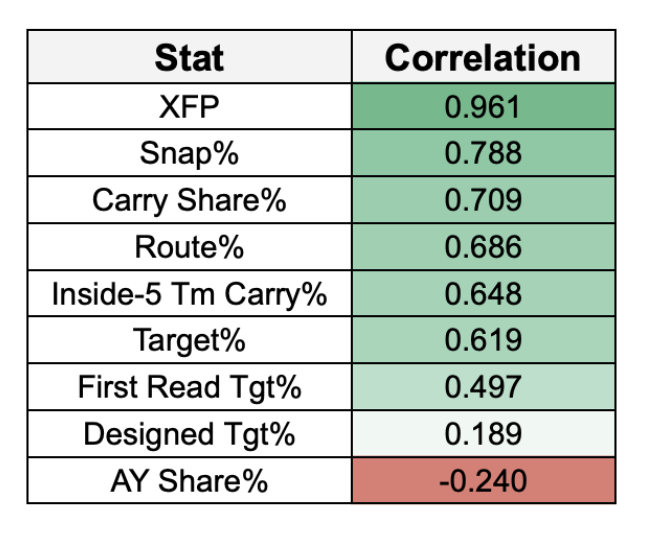
With more committee backfields than ever, understanding how your RBs are earning snaps and the value of those snaps is paramount. If you’re ever deciding between two RBs for fantasy and one plays on 65% of the snaps while the other projects for 50%, well, that’s a pretty good final determining factor in favor of the former (65% snap) RB.
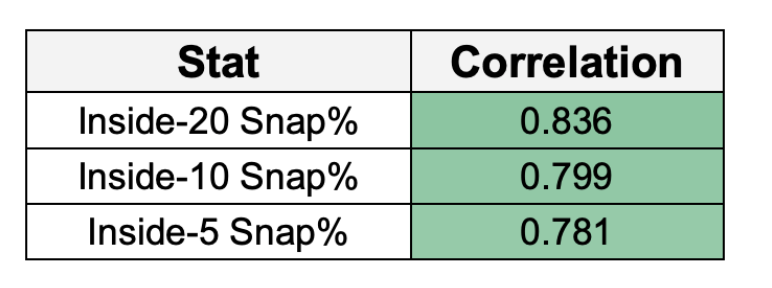
Snaps really matter when the offense gets into scoring range. (Shocker!).
For example, snap share in the red zone correlates better to raw fantasy points scored than any receiving usage stat (like route% or target%).
Check out my deep dive into RB red-zone usage and snap splits here.
Fantasy Points Data Suite
Two options:
Go to Bell Cow Report > sort by snap% (Snap Share)
Or for a deep dive…
Use the Play Filters (left-side menu) to sort by situation
Yards to goal = distance from end-zone (inside-20, inside-10, etc.)
Score = to determine which RBs play when leading/trailing
Down = to determine which RBs are playing on third-downs, early-downs, etc.
3. Target Share / First Read Target Share
After XFP, overall target share and first read target share are among the top usage stats to utilize for your WR and TE decisions.
Unlike RB scoring, where a number of things can work against the runner, WR and TE scoring is a lot more binary. Are you earning targets or not? And, are those targets consistently accurate or not?
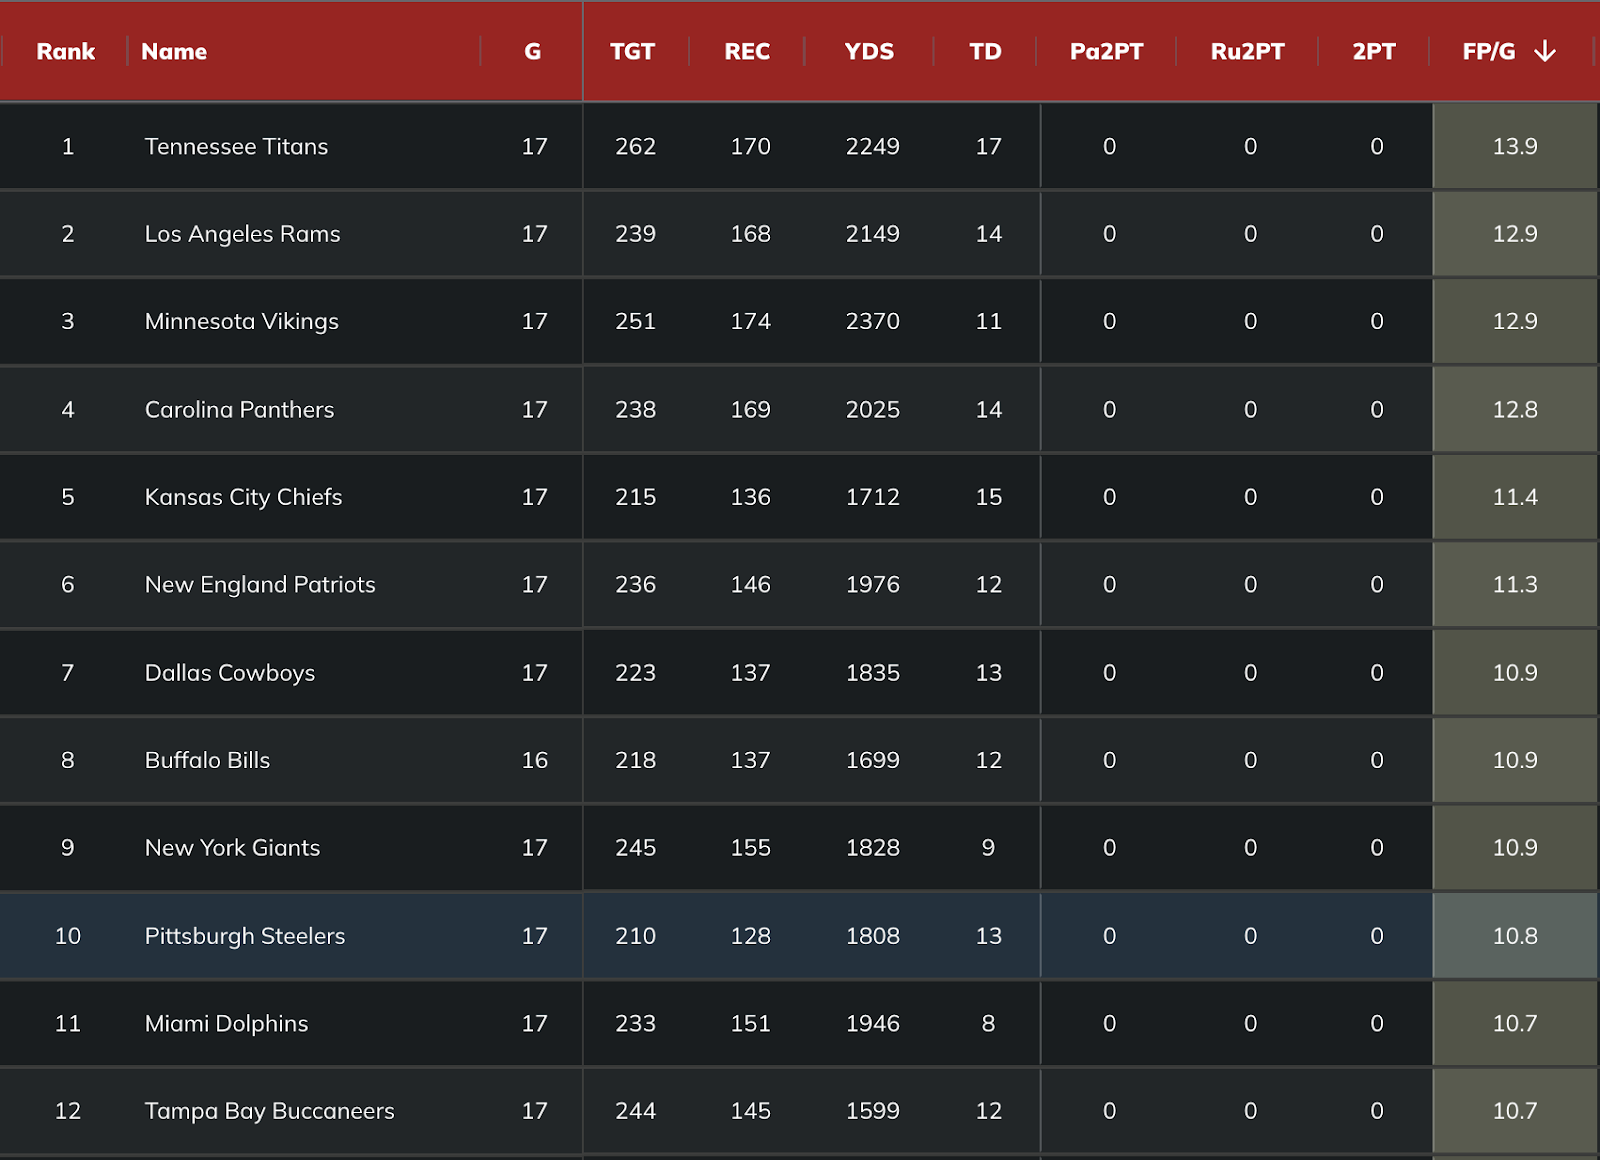
Basically, if you look at the top-25 list of players by target share, it’ll be an excellent guide for the top-scoring receivers. For example, here are last year’s leaders in target share…
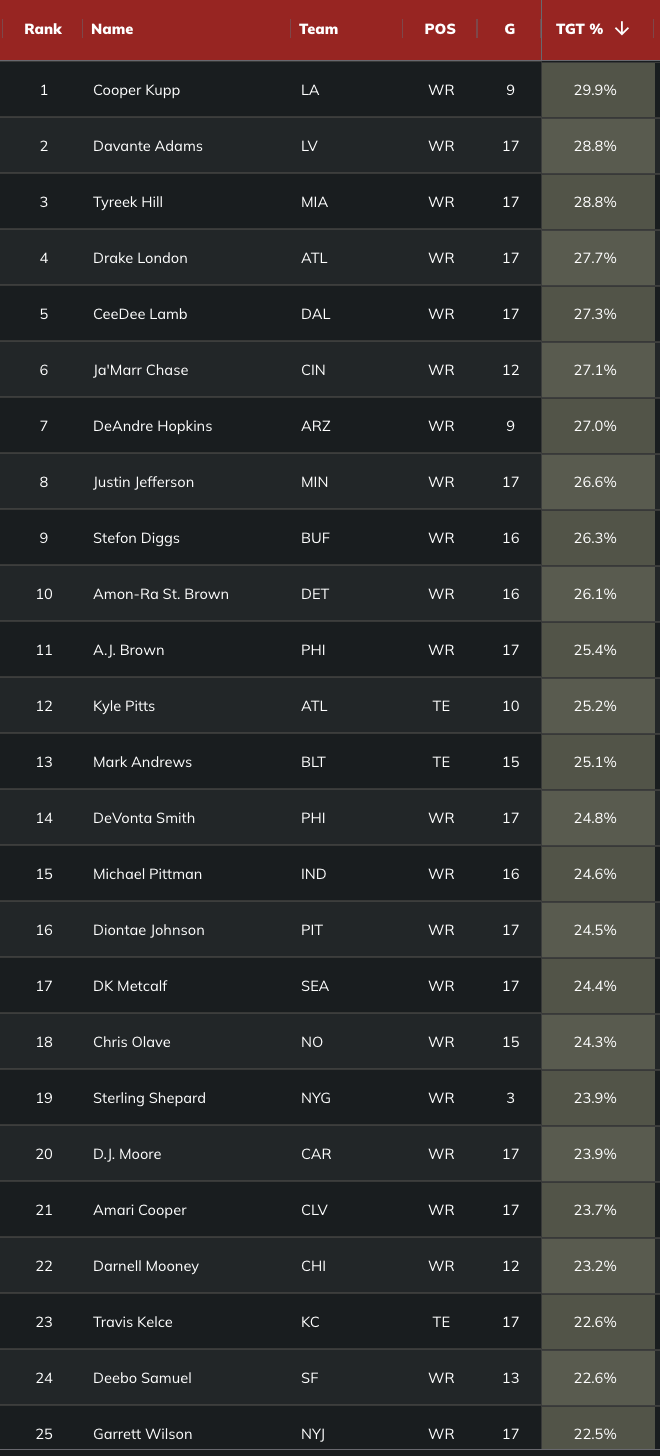
First read targets are plays where the pass was designed to go to a specific receiver (on the QBs first read), and the receiver actually earned the target on the play.
It tested out as an excellent statistic by its correlation to fantasy points, and our Ryan Heath expanded on First Reads and everything behind the stat in this masterful article.
Fantasy Points Data Suite
Advanced Receiving > Sort by TGT% (target share) and 1Read% (first read target share)
4. Route Share
Think about route share for receivers, like how we use snap rate at running back. Route share is the percentage of pass plays that a player is on the field for, and it’s of extreme importance to tight ends specifically.
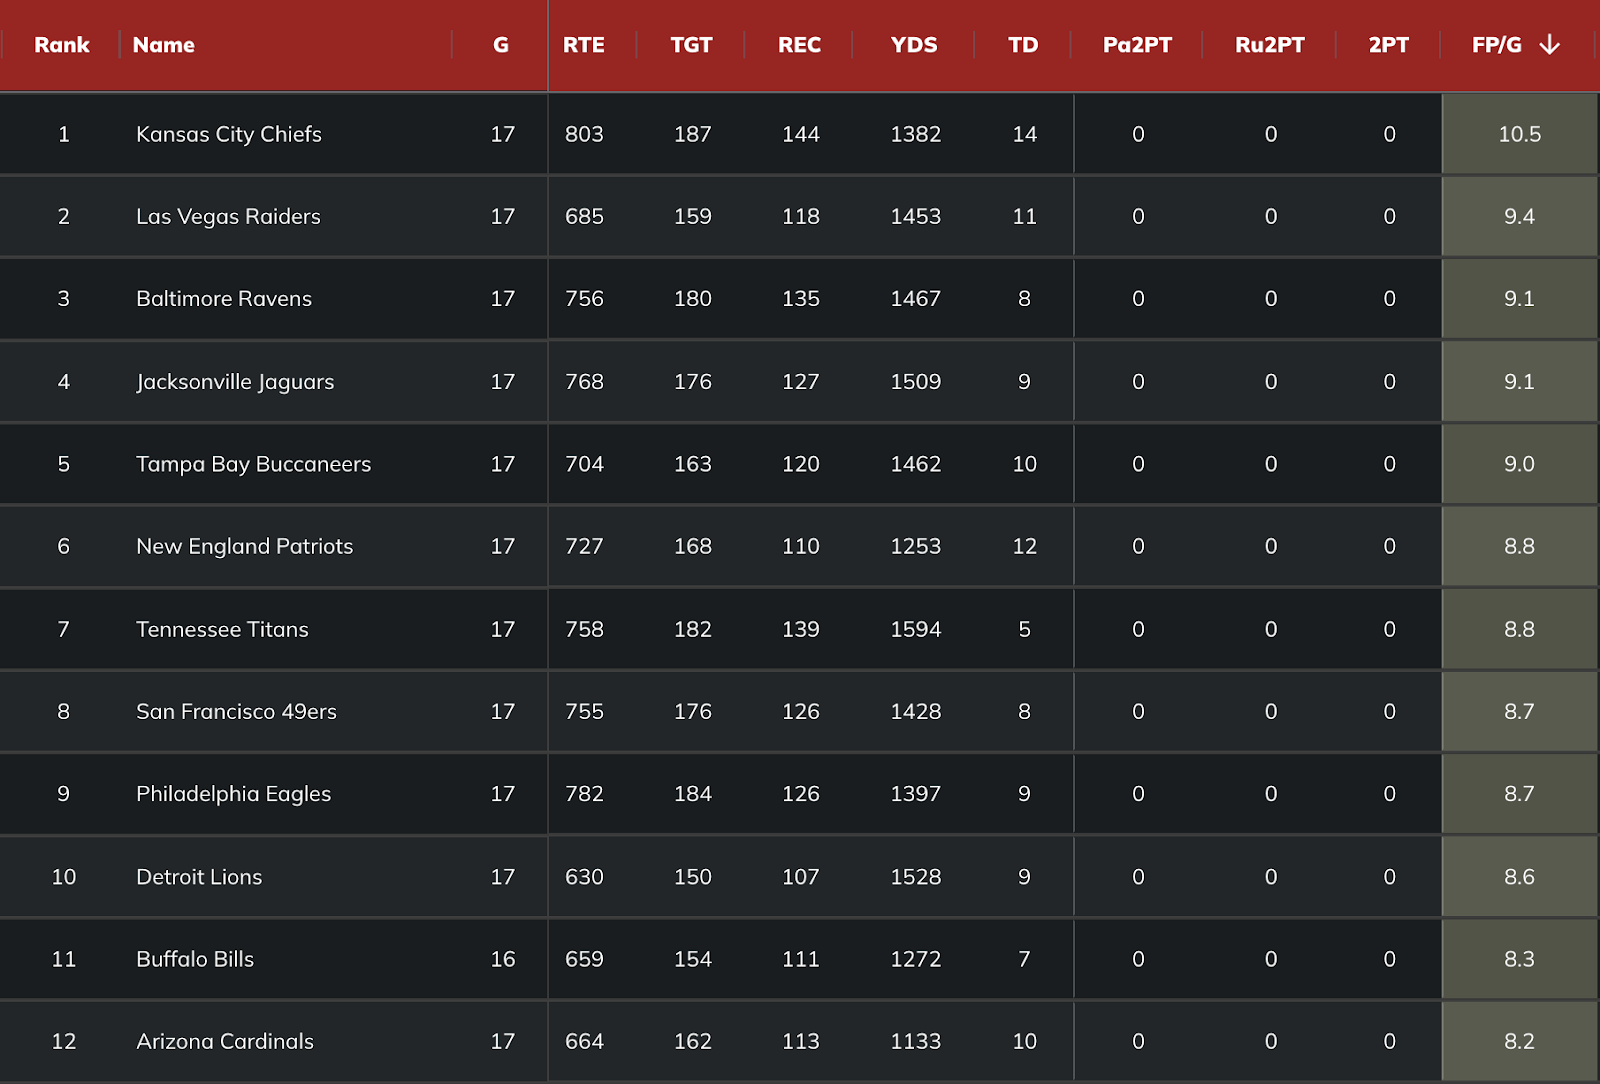
Only 12 TEs ran a route on at least 70% of their team’s dropbacks last season, and 10 of them finished inside of the top-12 scoring TEs by FPG.
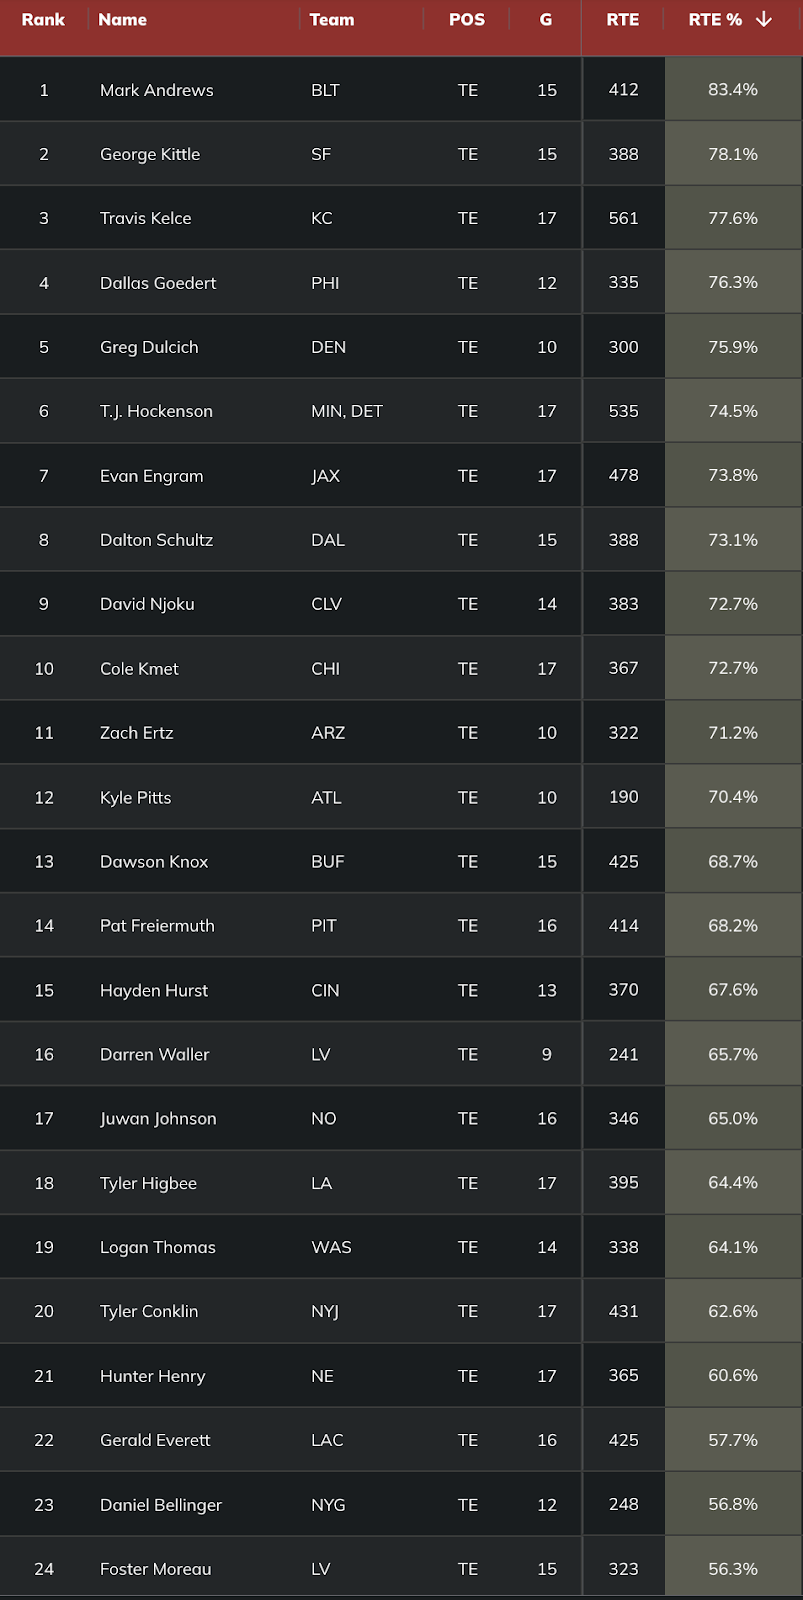
Only two tight ends that were top-12 in route share but didn’t finish top-12 in fantasy points per game – they were Cole Kmet (TE10 route share | TE17 FPG) and Kyle Pitts (TE12 by route share | TE20 by FPG).
Ideally, we would like to see Kyle Pitts back up to the 78.6% route share he had in his rookie season in 2021. It’s possible that Pitts was managing a hamstring injury (that caused him to miss Week 5) and take a few extra snaps off.
There are only a handful of every-down tight ends, but Mark Andrews is the one. Andrews easily led all tight ends in route share last season and ranked third (82%) in 2021, just marginally behind Darren Waller (83.3%) and Travis Kelce (82.1%).
Fantasy Points Data Suite
Advanced Receiving > Sort by RTE% (Route share)
5. Yards Per Route Run
Yards per route run (YPRR) is the GOAT efficiency stat for wide receivers and tight ends.
No other efficiency stat really compares to how well YPRR correlates to fantasy points.
Here is how YPRR stacks up against all other efficiency metrics at receiver. This data measures how well each stat (on the left-hand column) correlates with fantasy points (on the right-hand column).
Efficiency Stats - WR
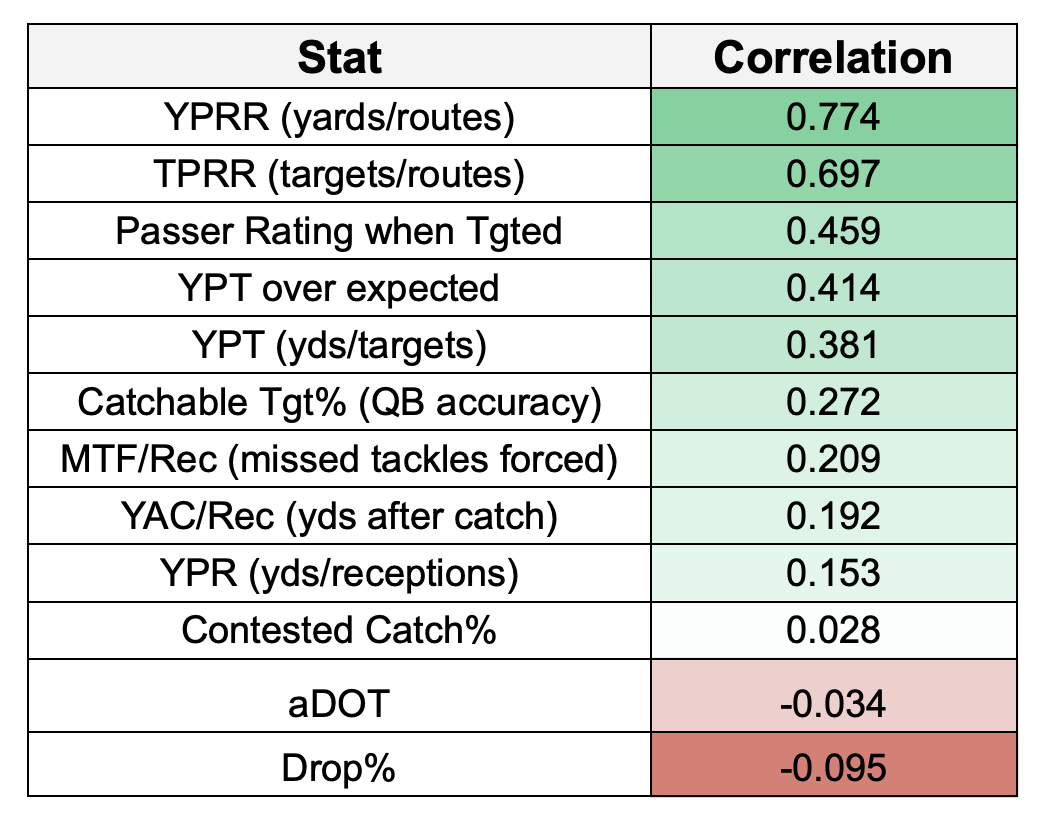
All correlation data is ranked by strongest (+1 | perfectly positive), weakest (0.0 | no correlation), to negative (-1 | perfectly negative).
YPRR and its sibling stat, targets per route run (TPRR), are by far and away the top efficiency stats to utilize for their moderately strong relationship to fantasy points.
TPRR is the receivers’ ability to earn targets.
YPRR is the receivers’ ability to convert those targets into production (yards).
Here’s the same look for tight ends…
Efficiency Stats - TE
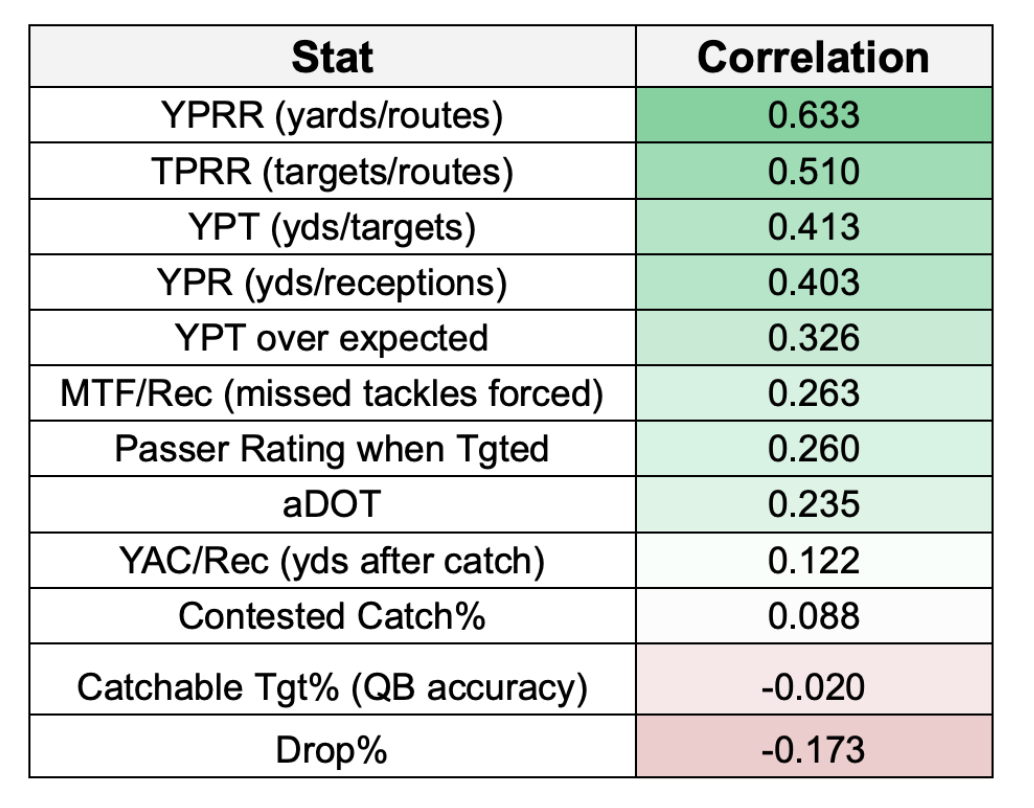
After targets and route share (as the main usage metrics), YPRR the ultimate efficiency stat for tight ends.
We can use YPRR to predict breakouts and one glaring stand out is Chig Okonkowo. He led all TEs in YPRR (2.83) last season – besting Travis Kelce (2.39) – however, Okonkwo only ran a route on 30.1% of the Titans pass plays. That’s set to spike upwards into at least the 70% range this season with no competition for snaps behind him. Titans TE2 Trevon Wesco is a blocking TE with eight career receptions.
Fantasy Points Data Suite
Advanced Receiving > Sort by YPRR
Or…
RB + WR efficiency report > Sort by YPRR
6. Catchable Throws / Targets
Catchable Throw rate is any pass that was deemed “on-target” for the receiver to have a chance to catch. On the flip side, we also chart “off-target” throws – which is exactly what it sounds like. These passes were so inaccurate that not even prime Calvin Johnson could have caught them.
There is some clear correlation between being accurate and being a good fantasy quarterback, although maybe not to the degree you think.
The top-6 QBs in catchable throw rate last year were:
1. Andy Dalton (79.4%)
2. Joe Burrow (79%)
3. Geno Smith (78.8%)
4. Tua Tagovailoa (78.5%)
5. Ryan Tannehill (78.5%)
6. Daniel Jones (78.4%)
While the bottom-6 quarterbacks were:
35. Zach Wilson (63.2%)
34. Deshaun Watson (68.8%)
33. Taylor Heinicke (70.3%)
32. Justin Fields (70.4%)
31. Russell Wilson (71.4%)
30. Joe Flacco (71.7%)
At the end of the day, scrambling ability and getting designed runs near the goal line is the trump card for the top-scoring QBs in fantasy now, and Justin Fields has that card in spades.
Conversely, catchable targets are of extreme importance for our fantasy receivers. I wrote thousands of words about this stat from a player and team level here.
Ideally, we want fantasy squads filled with receivers that have the ability to either lead their team in targets (and by a significant margin) or strong secondary receivers on extremely pass-heavy offenses.
The best way to think of this from a top-down approach is to weigh the total projected passing volume for a team like the Chargers compared to a run-heavy offense like the Bears. While Mike Williams will likely end the season with a lower target share than DJ Moore, Williams can more than make it up because of total volume.
Targets are earned but are not created equally. Continuing our Williams vs. Moore example – Justin Herbert will not only attempt more passes this season (more volume!), but he will be more accurate than Justin Fields.
Here are the last two years of team-by-team leaders in catchable throws (targets) per game, sorted by last season.
Catchable Targets per Game – by team
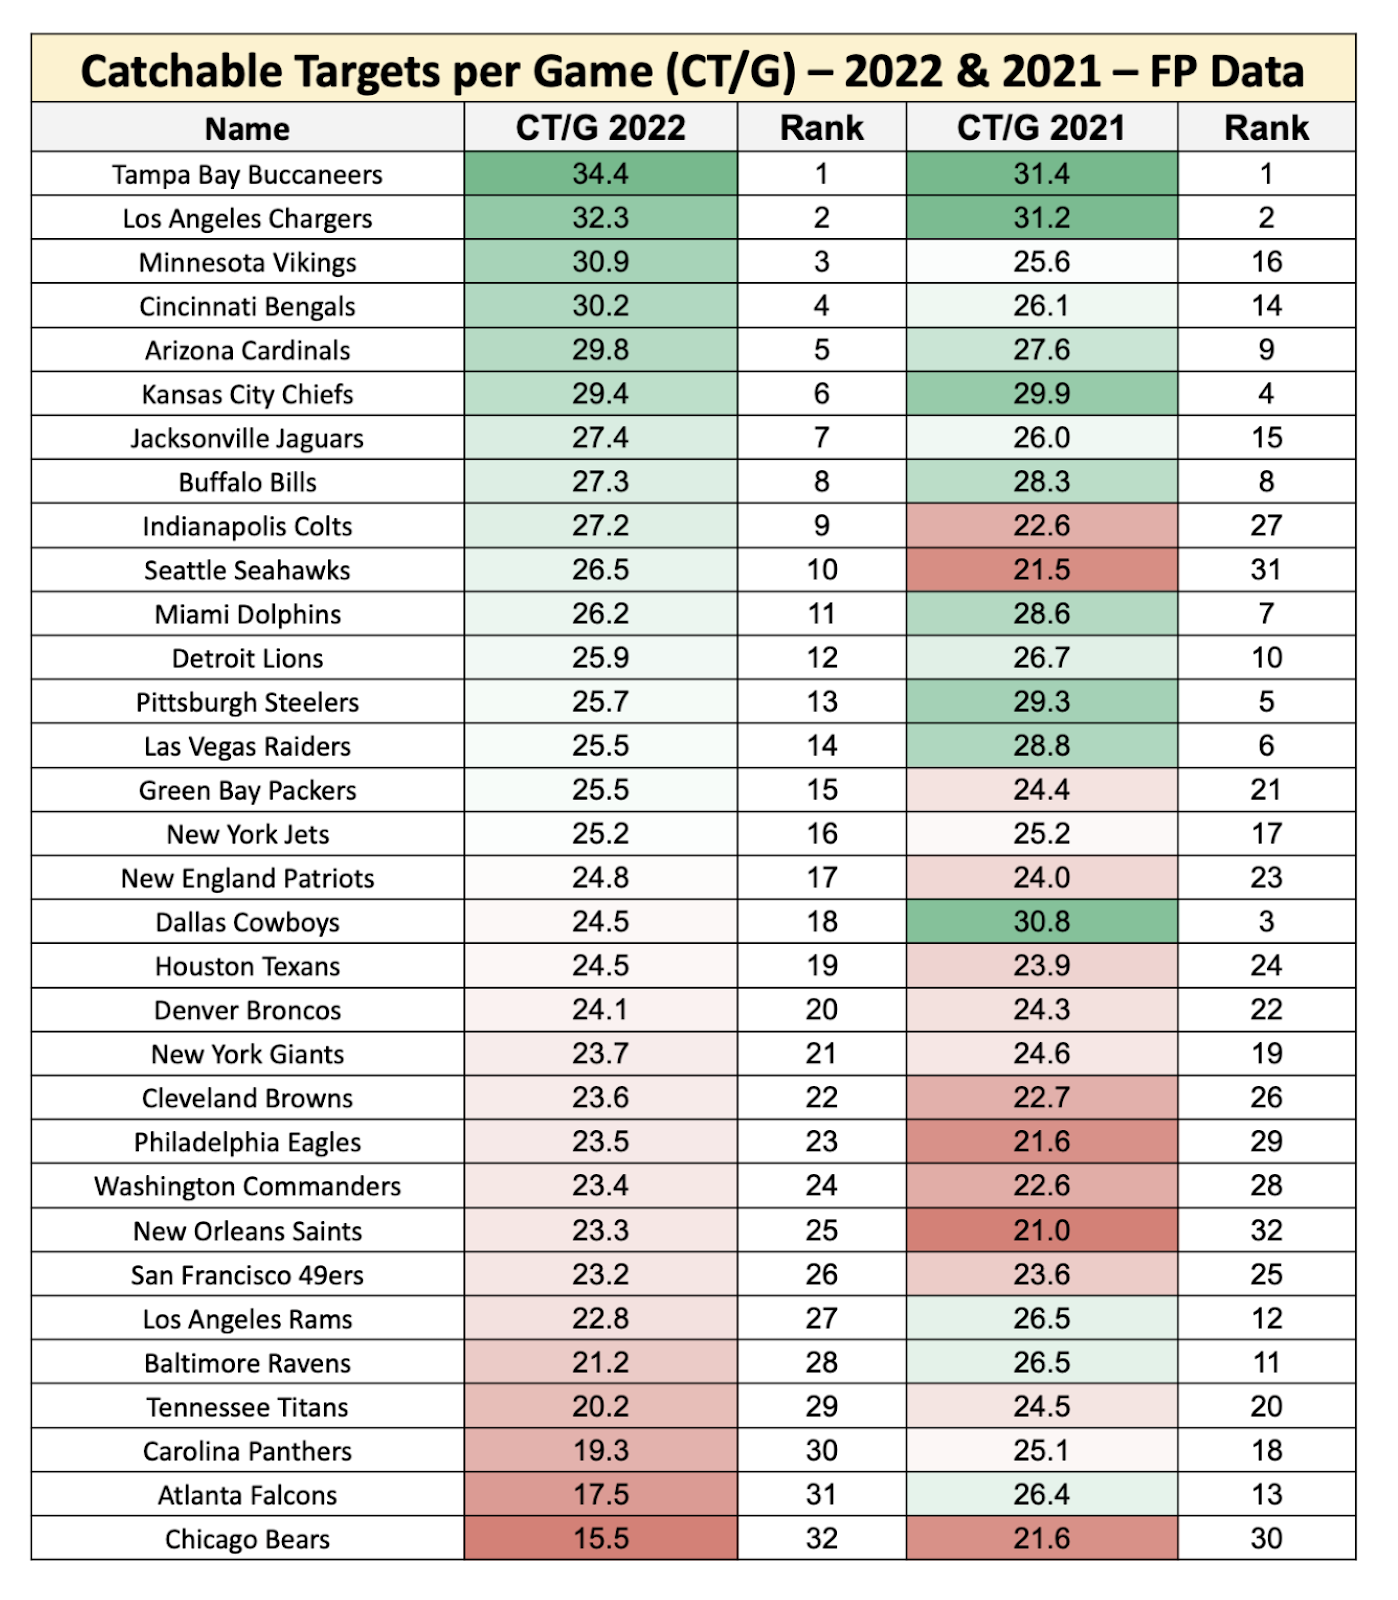
Also note that total catchable targets per game and early-down pass rate have a very tight relationship (0.848 | significant positive correlation). So, we’re capturing team-level volume that tracks very closely to pass rate and it factors in QB accuracy.
Fantasy Points Data Suite
Advanced Passing > Sort by CATCH% (catchable throw rate)
For receivers…
Advanced Receiving > Sort by CTGT (catchable targets) or CTGT% (catchable target rate)
Or look at this at a team-level view…
Fantasy Points Scored (offense) > Advanced Filter: Throw accuracy
7. Performance vs. Man/Zone
We should shift away from focusing on one-on-one WR vs. CB matchups because it’s so rare for a single cornerback to travel with an individual wide receiver for the entirety of a game. Generally, most defenses “play sides” with their CBs, and those defenders never leave their right- or left-side alignment. Slot CBs and nickel defenders typically stay inside.
Meanwhile, offenses use some form of motion on nearly every play to either get a pre-snap feel for coverage or to get their receiver in a better alignment to get open. Unlike at cornerback, most receivers move all over the formation.
What’s much more useful is analyzing how quarterbacks and their receivers perform against zone and man – with a heavy emphasis on zone since that is the dominant coverage.
Here’s a look at league-wide averages by coverage type.
NFL Coverage Averages – 2022 season (Fantasy Points Data)
| Type | Average |
| Cover-3 | 34.0% |
| Cover-1 (man) | 21.7% |
| Cover-4 | 15.2% |
| Cover-2 | 14.4% |
| Cover-6 | 9.7% |
| Cover-0 (man) | 3.1% |
| Cover-2 (man) | 1.9% |
These seven coverage types were run on 94% of pass plays last season (goal-line and red-zone coverage were intentionally left out).
Note that the overwhelming majority of man coverage is Cover-1 – a one, high free safety look with one-on-one coverage across the formation.
Cover-3 zone dominates league-wide with over one-third of the coverage snaps. Typically, Cover-3 is a one-high safety look – which can give a nice disguise for Cover-1 – and the strong safety helps against the run.
Base “two-high” safety looks are mostly Cover-2, Cover-4, and Cover-6.
I wrote an in-depth article about receivers' fantasy performance against man and zone coverages and highly encourage you to research in our Data Suite to utilize these metrics to help make your decisions better.
Fantasy Points Data Suite
Advanced Receiving > Advanced Filters (play) > Defense: Coverage Scheme
Or…
Advanced Passing > Advanced Filters (play) > Defense: Coverage Scheme
8. Yards after contact and missed tackles forced
Unlike at receiver and tight end, there really aren’t many good catch-all efficiency metrics for running backs. Remember earlier how we discussed how WR scoring is a lot more binary than RB scoring? This is what I meant.
Because running backs rely on so much that’s out of their control for success, it’s very hard to capture skill in between the noise. Runners not only need their offensive line to provide holes to run through, but they also need their offense to be generally pretty good so they can cash in short TDs in the red zone.
While volume is everything in fantasy, efficiency matters to varying degrees. Prime Alvin Kamara is a great example of making the most out of your 14-15 touches per game – in his case, efficiency really matters!
How many times, though, have you seen a mid RB become a starter and turn into a great fantasy option simply because of volume? Efficiency matters… but not as near as much as usage.
Obviously, being good at the game helps.
The runners that finished top-20 in both yards after contact and missed tackles forced per carry were:
Nick Chubb
Rhamondre Stevenson
Aaron Jones
Dameon Pierce
Tony Pollard
Travis Etienne
Raheem Mostert
Khalil Herbert
Tyler Allgeier
Fantasy Points Data Suite
Advanced Rushing > sort by YACO/ATT and MTF/ATT
9. QB Split Stats
One of the coolest things about the Fantasy Points Data Suite is our extremely powerful split tool (found in the left menu dropdown).
We have statistical splits in every tool, and for quarterbacks specifically, you can look up things like Patrick Mahomes’ numbers against every coverage scheme….
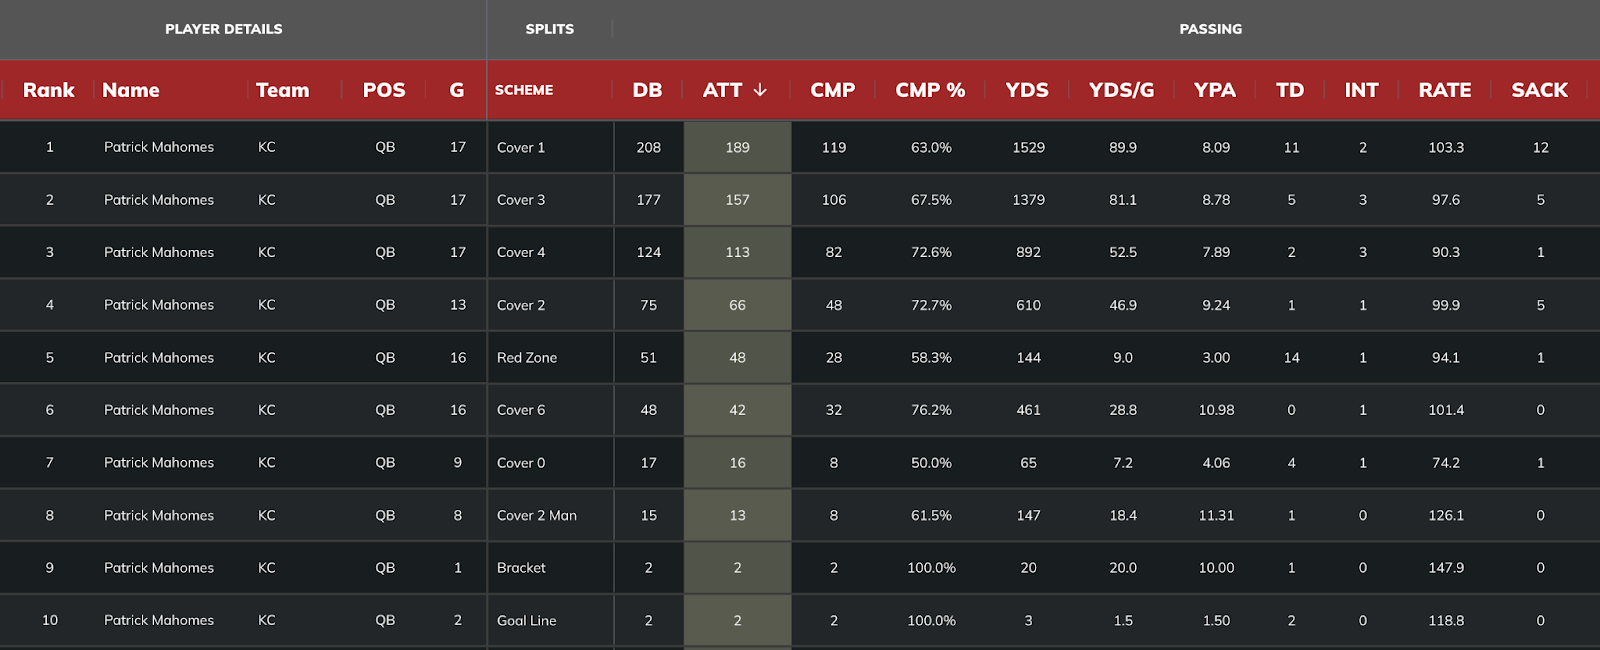
We can also split passing stats by play-action. Note that, like most QBs, Mahomes was more efficient off of play-action…
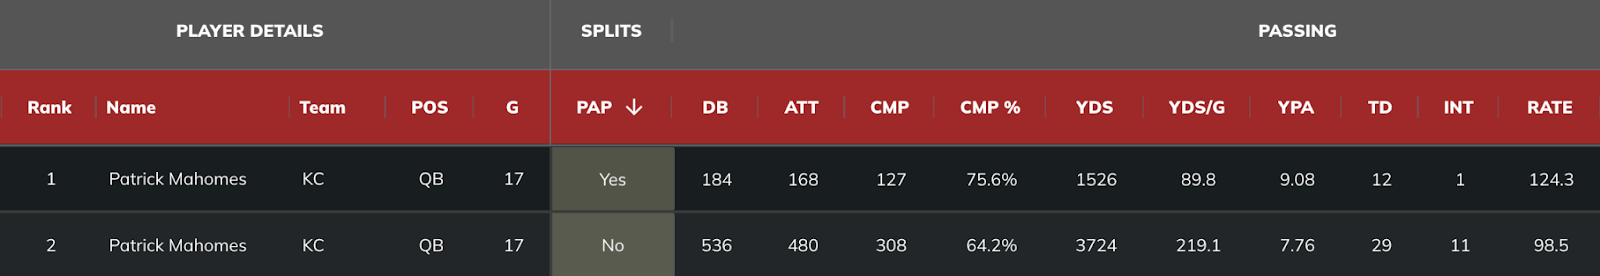
This means that Mahomes had a 124.3 passer rating and averaged 9.1 YPA on play-action last season vs. a 98.5 rating and 7.8 YPA on non-play action throws.
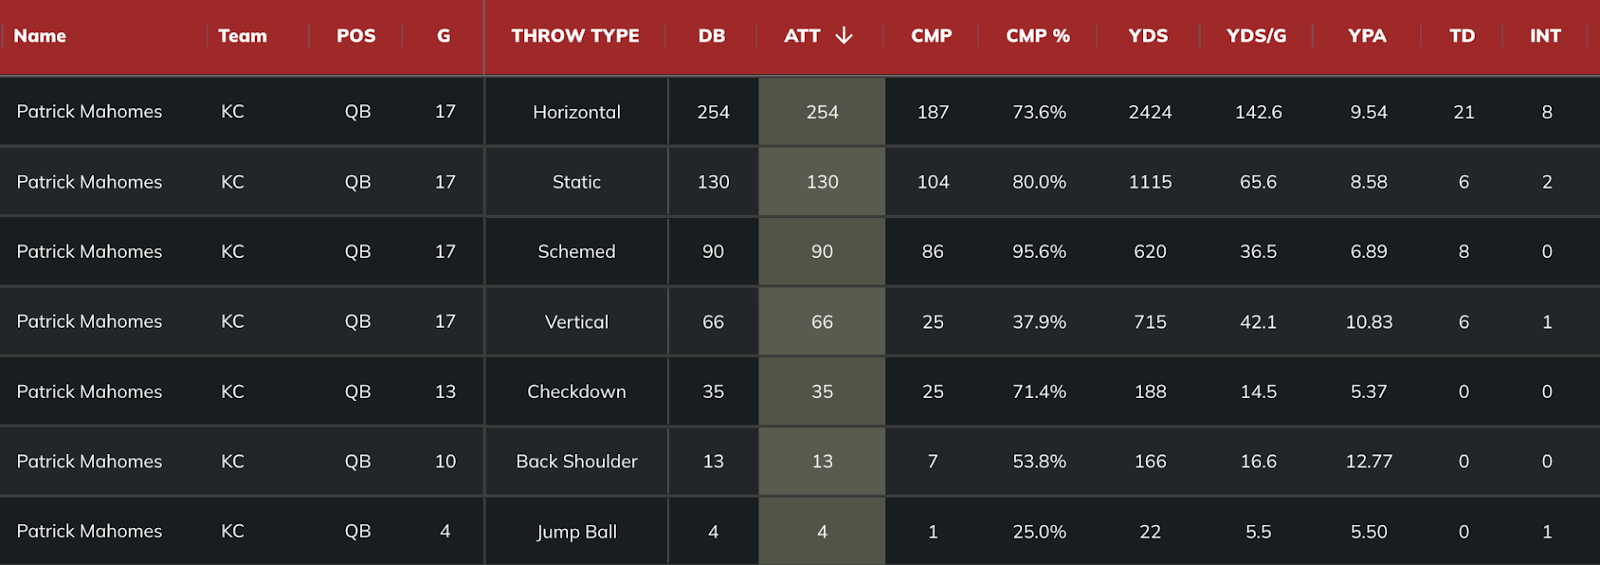
And we can sort by throw type…
Fantasy Points Data Suite
Advanced Passing > Advanced Play Filters > Passing
10. Fantasy Points Scored / Allowed
This section is reserved strictly for the in-season decisions – like start/sits, props, and DFS.
We can sort through fantasy points scored and allowed at the team level, then use the filters to find the most actionable stats.
For example, these 12 defenses allowed the most Half-PPR points per game to receivers aligned out wide last season:
Here is the same view, but for receivers that aligned only in the slot:
Fantasy Points Data Suite
Fantasy Points Scored > Team Defense > Advanced Filter (play): Targeted Alignment


