
All corners of the football world have one major thing in common – from everyone up to Jerry Jones all the way down to the “Taco” of your fantasy league – we’re all constantly searching for the next edge in player evaluation. As decision-makers have evolved from blindly relying on basic counting stats to leveraging empirically backed and professionally charted advanced metrics, the industry has become better at identifying the next breakouts and busts with every passing year. We may still be living in the Stone Age compared to the data revolution that’s occurred in the world of baseball, but their victory lap ends today.
Fantasy Points is proud to unveil a new proprietary metric that will push WR evaluation to new heights.
That metric is Average Separation Score (ASS). Ignore the “cheeky” acronym for a second (and then also that pun), and don’t let the word “Fantasy” in Fantasy Points fool you. We treat football data with the utmost solemnity and are not prone to hyperbole. So believe us when we say we genuinely believe this new metric has the potential to revolutionize the world of NFL analytics.
Thanks to the launch of this new stat and all accompanying tools within the Fantasy Points Data Suite, users can accurately identify which receivers are the best or worst at generating separation, offering an evaluation of WR skill wholly independent from QB play and target competition.
We have separation data available (dating back to the 2022 season) for every player, at every position, on every play of every game. This is available on a route-by-route basis allowing for specific analysis based on coverage type, player alignment, route concept, and more. And, remember, the Fantasy Points Data suite is fully customizable with innumerable “filter” and “split” options to take things even further from there.
TLDR: ASS — Average Separation Score — might be the greatest WR stat ever invented.
The importance of receiver separation
The concept of separation has long captured the imagination of the fantasy community but has also largely eluded us (at least on a full sample containing all players, on all routes, and in all games). Who creates the most separation and who wins against coverage most often was approximated based on other stats, such as yards per route run (YPRR).
More recently, GPS data has created the ability to estimate the average yards of separation a player gains across their routes. While both YPRR and GPS data are useful, these and other stats are not capable of incorporating critical context. Separation is nuanced — receivers do not have the opportunity to create separation on every play, whether that be because of the coverage deployed against them, because of other situational factors, or because the ball was thrown before the players entered the break in their routes. Thanks to our team of advanced play charters and their attention to detail, Average Separation Score finally offers a comprehensive score that accounts for all these intricate factors.
Unsurprisingly, this unique attention to detail pays off: Average Separation Score is stickier and more predictive of future targets and fantasy points than ESPN’s Open Score and Next Gen Stats’ Average Yards of Separation.
Shoutout to @Danny_Heifetz who went on the 3rd biggest sports podcast in America and gave a better ASS plug (pause) than anything I’ve done all year
— Scott Barrett (@ScottBarrettDFB) October 4, 2024
pic.twitter.com/yzPmgyfVna
The goal of ASS is to identify situations where a receiver is asked to create separation against a defense and to grade them when those opportunities arise. Take the example of a player running a 4-yard out route on 3rd-and-3 against man coverage with a defender lined up 5 yards deep. That player has to create separation and give the quarterback a chance to get the receiver the ball.
Now consider a wide receiver running a 6-yard hitch on 2nd-and-17 against a defender lined up 8 yards off the line of scrimmage and dropping into Cover 3. In this instance, the receiver is not required to create separation from the defender as the route and coverage combination ensure the play’s outcome is entirely determined by what the receiver does after the catch.
The two examples above are easy to identify and differentiate, but several situations inhabit a gray area between the polar extremes. Our team of charters work tirelessly to identify the situations that inhabit that gray area and isolate the situations that are dependent on the receiver creating separation from the defender.
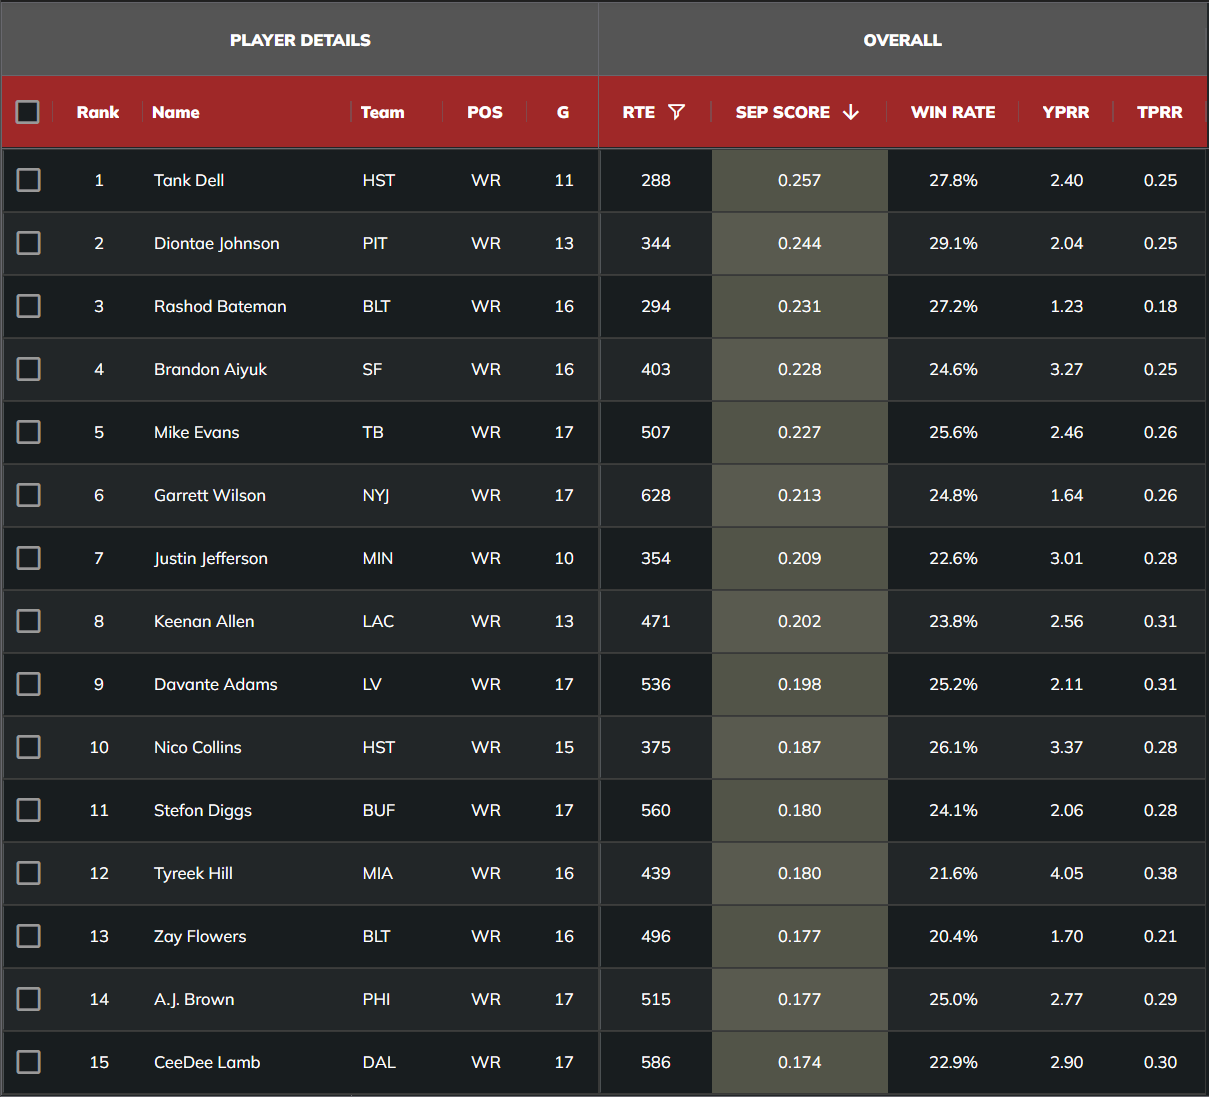
With all of these factors taken into account, grading on a -2 to +4 scale on every route, Separation Score can accurately identify the league’s best separators (Tank Dell), the worst (Quentin Johnston), and everyone in between.
The ASS Grading Scale
For further clarification on what goes into our grading scale:
A receiver earns a -2 grade when he is completely knocked off his route, taking him completely out of the play (example: receiver at the top of the screen)
A -1 grade is earned when a receiver is tightly covered and would require an exceptional effort from the QB to complete the pass (example: receiver at the top of the screen)
0 is any situation where the receiver does not have the opportunity to create separation. This also includes most screen passes, jet passes, checkdowns, and other targets where the receiver finds holes underneath coverage. (example shown earlier)
+1 is when a receiver creates a step in separation from the defender. (example: receiver at the top of the screen)
+2 is when a receiver creates multiple steps of separation from the defender (example: slot receiver at the top of the screen)
+3 is when a receiver creates extreme separation (example: receiver at the bottom of the screen)
+4 is when there is a bust in coverage, leaving a receiver wide open. (example: receiver at bottom of the screen)
A bust in coverage that leaves a receiver wide open because of a mistake by the defense is not counted into a receiver’s separation score, because the receiver did not create the separation that is gained by their own volition. Despite this, these situations are important to note (especially for you DFS players) because they track what defenses botch their coverages most or least often.
This scale and then the overall score help identify receivers who lose production because of poor quarterback play and which receivers create the most opportunities for themselves and their offenses. (Example: If Aaron Rodgers stays healthy this year, you’ll see how truly special Garrett Wilson is.)
In addition to Average Separation Score, we also offer another separation metric: “Route Win Rate.” This is a less predictive, more binary version of ASS, essentially telling us how often a receiver separated (earning a +1 score or better) on a percentage of his routes where separation was possible.
Using ASS in fantasy football
How can we leverage this exciting new stat for fantasy?
ASS shows us which players create the easiest opportunities for their quarterback to get them the ball. As every astute fantasy player knows, targets are the lifeblood of fantasy scoring for receivers. The better you are at separating (especially relative to your teammates), the more likely you are to get the ball, and the more fantasy points you’re likely to score. We can keep things this simple, or we can go as deep into the weeds as we want.
For instance, ASS will eventually enable us to take coverage matchup analysis to the next level. ASS allowed by defense can help identify specific matchups in which pass catchers will have an easier or more difficult time separating. We can get even more granular with separation score by coverage, which allows users to see what players have shown promise in separating against specific coverages, potentially giving insight against different defenses week to week. But we’re really just getting started here. ASS can be further broken down by alignment, by route, by route break, by route depth, etc.
Because targets are earned, utilizing a market share of separation score could help identify which players on new teams have a chance at higher productivity (Diontae Johnson). We can also consider the opposite scenario — a WR who may struggle to separate but was only productive last year thanks to elite or hyper-aggressive QB play (basically the entire career of Marquez Valdes-Scantling).
Separation Score is a unique tool that can add context to these situations and aid in identifying pass-catcher regression in either direction. The amount of insight that can be used from this stat to further evaluate WRs and potentially predict which receivers could receive more targets as the season rolls on, or what WR groups will match up well with what secondaries based on their ability to separate could be endless.
Overall, the goal of ASS is to find out what players, independently, are able to create the most opportunity for targets and the most opportunity to potentially gain YAC – because the more open a receiver is, the higher their YAC-based expectation should be as well (see below) – both of which are key variables in determining a player’s fantasy output.
| Average YAC | Average Yards Until 1st Contact | |
| -1 | 2.0 | 0.9 |
| 1 | 3.5 | 1.9 |
| 2 | 5.9 | 4.2 |
| 3 | 8.2 | 6.9 |
A score of zero is not shown because many zeroes are the result of the defense, on which the receiver did not do anything to win his route or lose it and is likely sitting in between zones with defenders many yards away.
Fantasy-Relevant Takeaways
For more immediate fantasy-relevant takeaways, check out our latest article “Average Separation Score: Dank Stats, Sleepers, & Breakouts.”
A word from Director of Analytics Chris Wecht
While Average Separation Score is still very much in its infancy, it has already shown promising results towards predicting future fantasy success compared to other non-counting stats, such as missed tackles forced per touch. It’s not as predictive of future fantasy points as “yards,” but that’s to be expected, given that receptions are a key variable in calculating fantasy points.
There’s another inherent problem with counting stats like targets, yards, receptions, etc., and that’s that they require the quarterback to throw the receiver the ball to accumulate any of those stats. Separation Score reflects player performance while removing the need for that player to earn a target — giving us a much larger skill-based dataset for WRs.
In both 2022 and 2023, 66 wide receivers and tight ends ran 300+ routes. This is, without a doubt, a small sample size, but it’s all we have right now. (I look forward to running all of these tests again next year and will always be fully transparent with my results.)
Here is the predictiveness of Average Separation Score to next year's (PPR) fantasy points per game:
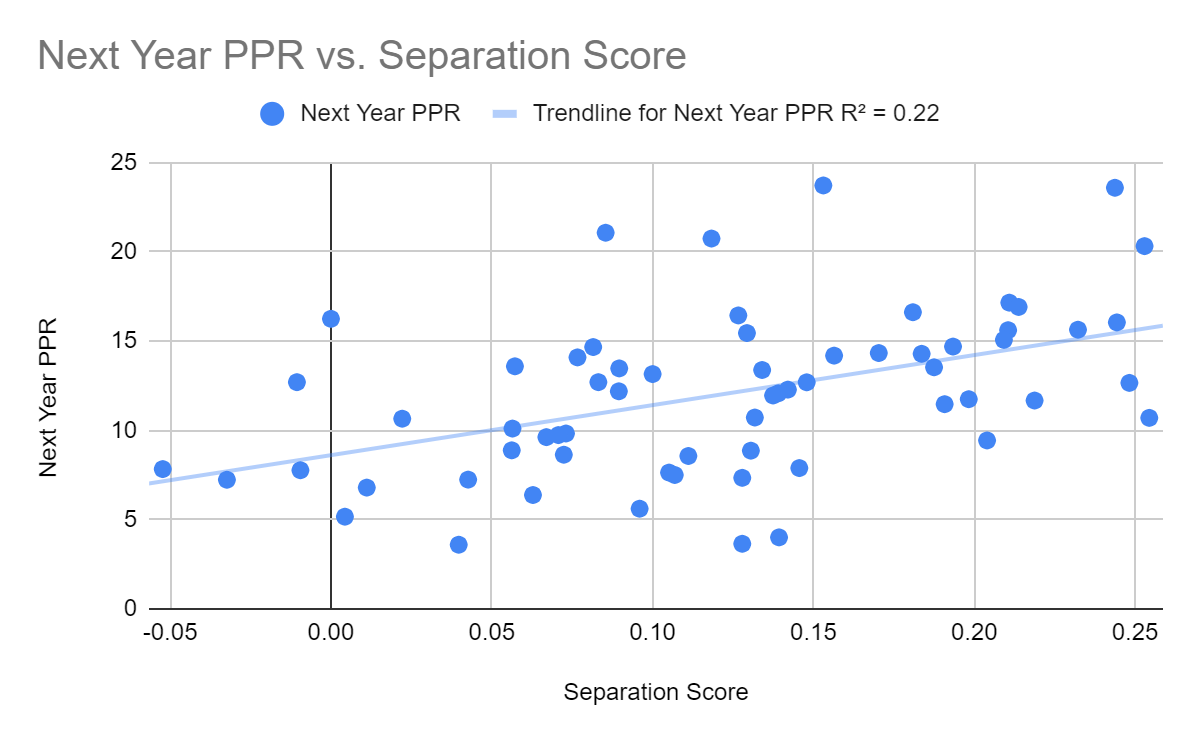
A 0.22 correlation may not seem super strong, but for a non-counting stat, that is very impressive in its early infancy. For example, missed tackles forced and aDOT have even lower correlations to future fantasy points.
I ran next-season correlations again, but this time with WRs only. I'm glad I did.
— Ryan Heath (@RyanJ_Heath) February 25, 2024
First downs appear to be the best volume stat (PPR scoring).
Though close, YPRR is narrowly beaten by first downs per route run (1D/RR) as an efficiency stat.
Does anything here surprise you? pic.twitter.com/6PtGiD079n
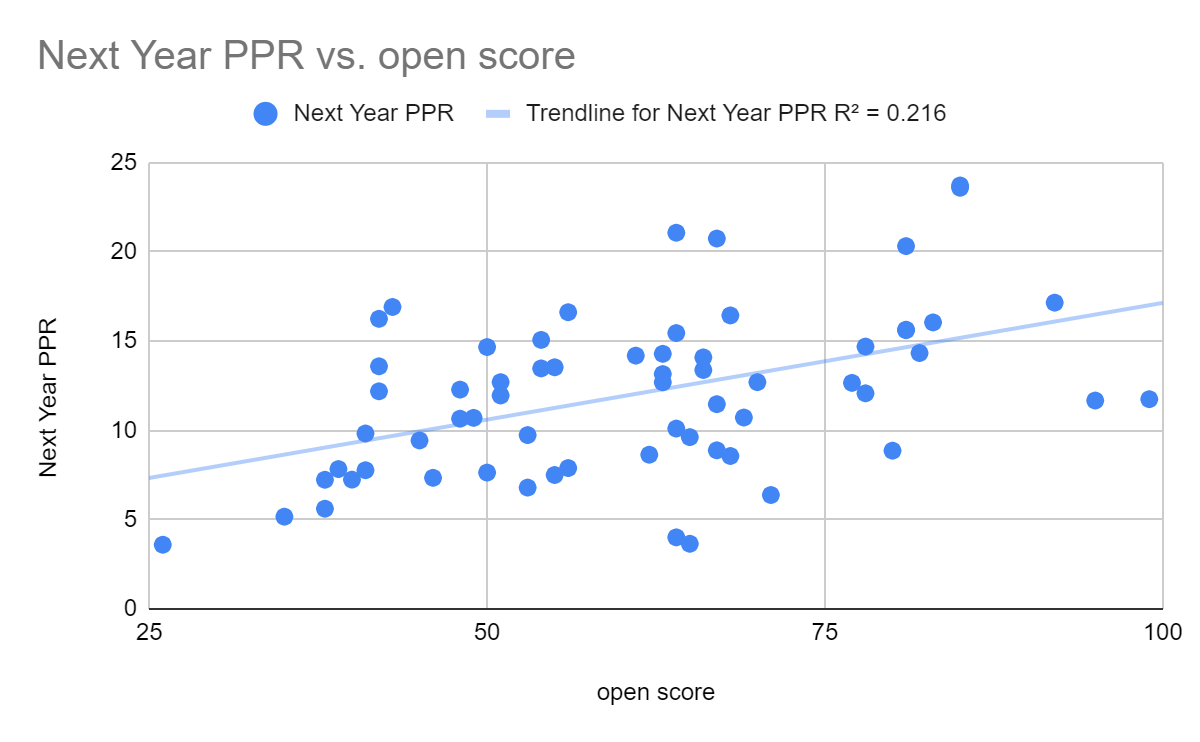
Not only that, but it actually has a stronger correlation to future fantasy points than ESPN’s Open Score metric across the same sample of players.
The next question you may be asking is, “If a player grades out as a good separator one year, does that mean they are likely to be a good separator in the next year as well?” Again, we’re working with a small sample, but so far, the results are very promising. This does look like a surprisingly “sticky” metric.
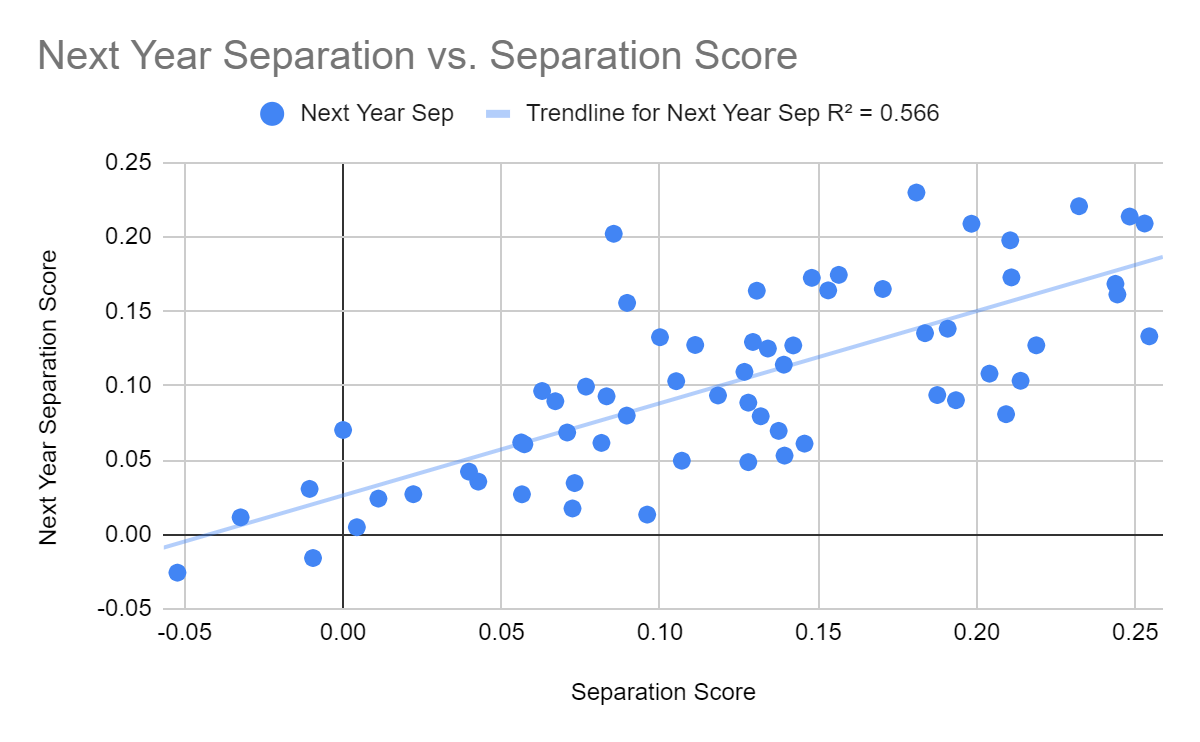
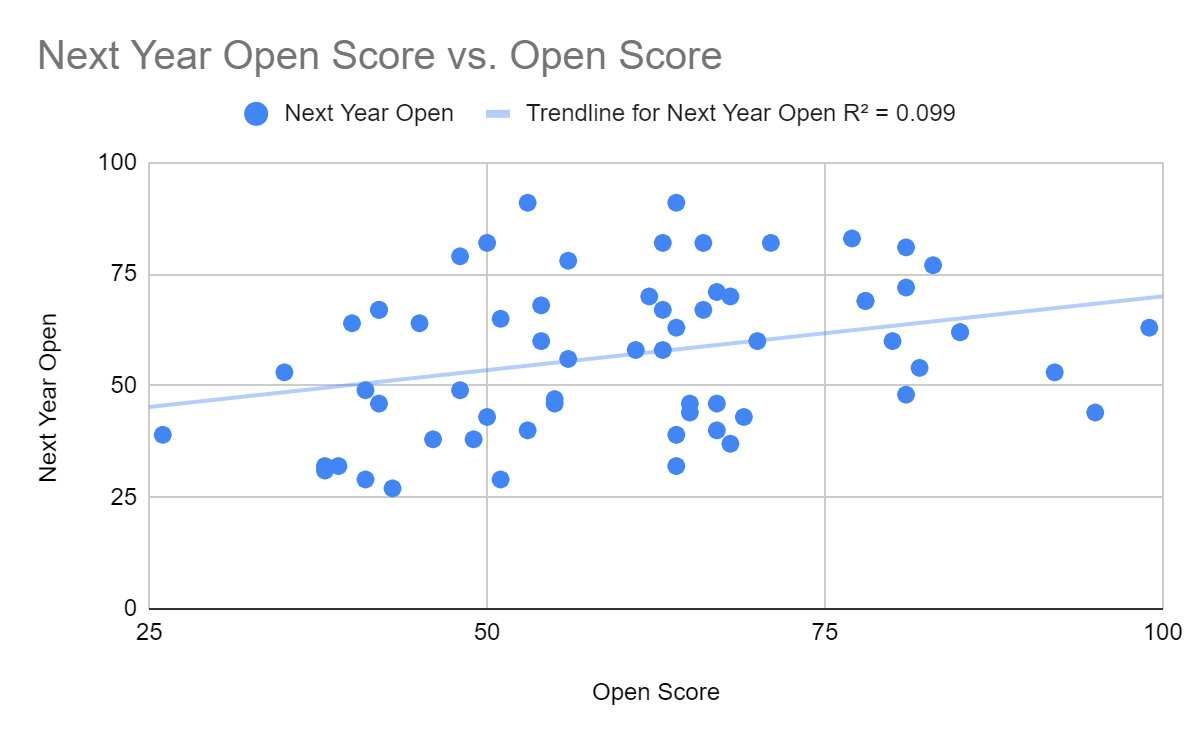
Separation Score shows a 0.566 correlation to future year separation scores, trouncing ESPN’s Open Score, which showed only a 0.099 correlation to future year Open Score.
All this to say… While we are aware that with only two years of data, we don’t fully know the impact Separation Score will have on predicting future receiver performance, we are extremely pleased with the initial results. We believe it is the best stat on the market at evaluating how receivers separate on every route they run because we factor in the play call, down, distance, situation, defense, and anything else that could affect if the receiver was ever designed to get separation on the play.
We are even working on coming up with an over-expectation metric that helps tell us how receivers performed given what they were asked to do. For instance, if a player was only asked to run clear-out go routes (*cough* Marquez Valdes-Scantling), then they aren’t going to have a strong Separation Score.
This is an extremely important note about this stat, and its current limitations in its “non-over expectation” form. If a wide receiver such as MVS is asked to run go routes on 75% of his routes, he simply isn’t going to get an opportunity to get good separation scores like a player such as Rashee Rice, who is running a lot of crossers and comebacks.
Routes with hard breaks like Ins, Outs, Hitches, Comebacks, etc. give the receiver the best opportunity to generate strong separation scores, but not every receiver can run high-value routes on every play. Clear-out go routes are important to many play concepts, so by nature some receivers are going to be cardio kings with a low ASS.
To put some numbers on this concept, horizontally breaking routes (Crossers, Ins, Outs, etc.) have an average separation score of 0.16 and an average win rate of 26%. Vertical routes (Gos, Post, Corners, etc.) have an average separation of 0.046 and a 14% win rate. Static routes (Hitches, Comebacks, Curls, etc.) have an average separation of 0.05 and a 14% win rate.
Okay. So, it’s easier to get open on horizontal routes, but does that matter for fantasy? The answer is yes!
| FP/RR | TPRR | YPRR | |
| Horizontal | 0.324 | 19.7% | 1.54 |
| Vertical | 0.264 | 13.2% | 1.32 |
| Static | 0.286 | 18.7% | 1.34 |
You do want players running horizontal-breaking routes for fantasy.
Here’s one example for this upcoming season: 35% of Diontae Johnson’s routes had horizontal breaks. That number led the Steelers in 2023 and he had an average separation score of 0.24. Only 29% of George Pickens’ routes had horizontal breaks, but he ran 194 vertical routes leading the team. Someone has to fill the route void left by Johnson, and Pickens had a 0.24 separation score on those routes, 2nd-highest on the team.
We can see a similar example with Tyler Lockett. Lockett, D.K. Metcalf, and Jaxon Smith-Njigba all ran about the same number of horizontally breaking routes in 2023. But Lockett had a 0.20 average separation score compared to DK’s 0.10 and JSN’s 0.11. It doesn’t seem likely that the Seahawks are just going to be able to phase Lockett out of their gameplan unless one of these other receivers can improve on horizontally breaking routes.
There are also certain defensive coverage schemes that will naturally lead to higher/lower separation scores.
Cover 2, for example, has an average separation score of 0.036 which is by far the lowest of the main defensive coverage schemes. Cover 1, on the other hand, has an average separation score of 0.102, nearly triple that of Cover 2. With two deep safeties, corners playing the flats, and the rest of the defenders patrolling the middle of the field, Cover 2 is the scheme that is going to give us the fewest 1v1 matchups between receivers and defenders, resulting in more 0 or neutral separation scores on the routes run. Cover 1 is a straight-up man defense, so virtually every route run is going to have a winner or loser with the occasional neutral score as well.
| Sep Score | Win Rate | FP/RR | |
| Cover 0 | 0.068 | 19.1% | 0.49 |
| Cover 1 | 0.102 | 26.6% | 0.32 |
| Cover 2 | 0.037 | 6.01% | 0.29 |
| Cover 2 Man | 0.080 | 25.0% | 0.26 |
| Cover 3 | 0.078 | 12.6% | 0.32 |
| Cover 4 | 0.064 | 12.0% | 0.30 |
| Cover 6 | 0.063 | 11.0% | 0.30 |
As we collect more data, we are going to be working on building a separation over expectation score that can help us differentiate between a receiver's actual ability to get open versus what they were asked to do in the offense, the types of routes they were running, and the defensive coverages they saw. We hope to add this metric as early as next year (with a more robust sample), and we believe this should help improve the predictiveness of ASS even further.
Players that get open with big separation scores are going to be among the most valuable in fantasy. Below is a table showing how valuable each route with each separation score is.
| Separation Score | FP/RR | TPRR |
| -2 | 0.03 | 13.3% |
| -1 | 0.09 | 19.0% |
| 0 | 0.23 | 14.8% |
| 1 | 0.82 | 40.5% |
| 2 | 1.65 | 54.4% |
| 3 | 2.61 | 61.3% |
Simply going from a neutral separation score to a positive separation score results in a +36% increase in target per route run and a tripling of the player’s fantasy points per route run. This is why a player’s win rate is valuable to know for fantasy. The more they are racking up positive separation scores, the more valuable their routes are. To take it a step further, if a player gets a perfect separation score value of +3 (of which there have been only 630 instances over the past two seasons), that is more valuable than a player who gets three scores of +1 per game. Big-time separators are going to lead to big-time fantasy scores over time, and betting on guys who have shown the ability to separate can lead to future fantasy success.


