
Fantasy managers are pushing the panic button over how poorly certain position groups have been performing — it feels like quarterbacks and tight ends are having historically bad seasons.
The way these positional groups are playing isn’t just affecting themselves — it is also affecting the values of the running backs and wide receivers. Unless you are looking at WAR (wins above replacement), you may be missing out on this.
I am going to keep emphasizing this — WAR is updated every Tuesday morning. Fantasy Points is the only place where you can track WAR across six different league types AND have access to Flex and Superflex position WAR values. Do not let other managers use this tool when you have the opportunity to take advantage of it!
This study was done after Week 3 of the NFL season. I will do another look as we get closer to the midway point. Since there are only three games to gain insight from, we will be using WAR/G instead of WAR. WAR/G gives us the probability that a manager got a win from having that player in their lineup and average starters at all the other positions. This is also available in the data posted weekly.
I will use the last 10 years of historical fantasy football data to determine how players at each position are valued in WAR/G for 2-WR PPR leagues. To understand how this impacts other league types, check out my first article, where I broke down WAR for all of the leagues that data is tracked for.
WAR/G Overall

While we are about to dig deeper into each position, here is how they all stack up to the established WAR/G over the last ten years. It is important to remember that this is over three games.
Quarterbacks
| Rank | QB WAR/G | QB WAR/G History | QB Difference |
| 1 | 0.30 | 0.23 | 0.07 |
| 2 | 0.28 | 0.19 | 0.09 |
| 3 | 0.26 | 0.17 | 0.09 |
| 4 | 0.17 | 0.15 | 0.02 |
| 5 | 0.17 | 0.14 | 0.03 |
| 6 | 0.17 | 0.13 | 0.04 |
| 7 | 0.14 | 0.11 | 0.03 |
| 8 | 0.12 | 0.11 | 0.01 |
| 9 | 0.12 | 0.11 | 0.01 |
| 10 | 0.11 | 0.10 | 0.01 |
| 11 | 0.11 | 0.09 | 0.02 |
| 12 | 0.07 | 0.09 | -0.01 |
| 24 | 0.00 | 0.02 | -0.02 |
| 36 | -0.06 | -0.01 | -0.05 |
Even though this has been a “down” year for quarterbacks, the top 12 quarterbacks are still performing better or at their historical WAR/G baseline. Josh Allen, Jayden Daniels, and Lamar Jackson are dominating and it shows in their WAR/G. The rest of the top 12 are performing close to their historical baselines, with Joe Burrow rounding it out.
The issues start to arise with QBs 13-24 and later. While they are performing only slightly below the historical baseline for the next 12, they only continue to get worse. The depth of the position has been lacking and players that we were expecting to perform well have not. Patrick Mahomes, Anthony Richardson, and Trevor Lawrence have not been what we wanted, so it makes the position look even worse.
While the WAR/G has not been too different from the historical baseline, the fantasy points per game have been lower (as discussed on the last Dynasty Points show). This just isn’t impacting how they are valued compared to the rest of the lineup. Even though there is a lower overall average for the starters at the position, the replacement level value of the quarterback position being lower helps counteract it. The quarterback position does bring down the fantasy points of the lineup. This will impact the other positions.
Running Backs
| Rank | RB WAR/G | RB WAR/G History | RB Difference |
| 1 | 0.47 | 0.35 | 0.12 |
| 2 | 0.44 | 0.28 | 0.15 |
| 3 | 0.33 | 0.26 | 0.06 |
| 4 | 0.32 | 0.24 | 0.09 |
| 5 | 0.31 | 0.22 | 0.09 |
| 6 | 0.31 | 0.21 | 0.11 |
| 7 | 0.29 | 0.19 | 0.09 |
| 8 | 0.27 | 0.18 | 0.10 |
| 9 | 0.27 | 0.17 | 0.10 |
| 10 | 0.26 | 0.16 | 0.11 |
| 11 | 0.25 | 0.15 | 0.10 |
| 12 | 0.24 | 0.14 | 0.10 |
| 24 | 0.13 | 0.09 | 0.05 |
| 36 | 0.01 | 0.04 | -0.04 |
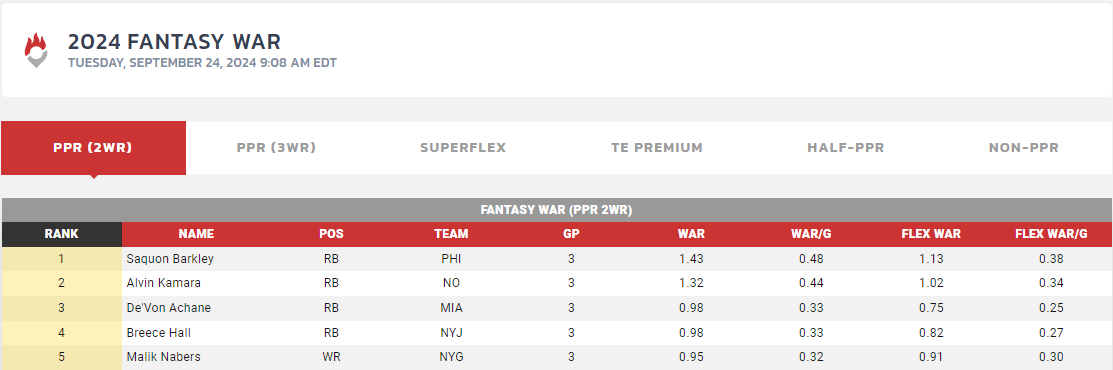
The Running Back position has been making something of a resurgence this season. The top 14, in particular, are absolutely dominating. This is even with Christian McCaffrey not playing a single snap. There are 33 running backs that have a higher WAR/G compared to the historical baseline. For the top 14, it is significantly higher than the historical baseline for most. The running back position has proven to be deep, with valuable players at the top. 15 running backs make up the top 30 players in WAR through Week 3.
The current RB12 in FPTS/G is Jonathan Taylor at 17.6. In 2023 it was also Taylor, but he was averaging 15.6 then. That is a significant pickup in points. While McCaffrey was RB1 in 2023, he averaged 24.6 FPTS/G. Saquon Barkley is averaging 28.1 as the RB1 this season. This extends down to the RB24, with a 13.3 average this season compared to a 12.5 average last season.
The position's WAR/G is higher this season for a few reasons. The starters are scoring more fantasy points, and replacement-level players are scoring fewer fantasy points. Running backs are also making up a higher percentage of the points for the lineup.
I am sure this will start to come back to the historical baseline as the season progresses, suggesting that there will be some regression for the position. There will be more running backs contributing to teams, and the elites at the position will eventually have some poor performances. I would look to take advantage of the value in the position now to upgrade your roster through trades.
Wide Receivers
| Rank | WR WAR/G | WR WAR/G History | WR Difference |
| 1 | 0.32 | 0.26 | 0.06 |
| 2 | 0.28 | 0.22 | 0.06 |
| 3 | 0.28 | 0.19 | 0.08 |
| 4 | 0.23 | 0.17 | 0.06 |
| 5 | 0.22 | 0.16 | 0.05 |
| 6 | 0.21 | 0.15 | 0.06 |
| 7 | 0.21 | 0.14 | 0.07 |
| 8 | 0.16 | 0.13 | 0.03 |
| 9 | 0.16 | 0.12 | 0.04 |
| 10 | 0.16 | 0.11 | 0.05 |
| 11 | 0.15 | 0.11 | 0.04 |
| 12 | 0.15 | 0.10 | 0.05 |
| 24 | 0.08 | 0.06 | 0.02 |
| 36 | 0.03 | 0.02 | 0.01 |
Wide receivers have been performing well on the season, albeit not as well as the RBs, but still well. The top 46 wide receivers are all averaging more WAR/G than the historical baseline, but only the top 12 are doing so in a semi-significant manner.
Through Week 3, The biggest difference in FPTS/G for the top 36 wide receivers is at WR1, where CeeDee Lamb was averaging 23.8 FPTS/G in 2023 compared to 22.9 for Malik Nabers. After WR5, there is no more than a 0.5 FPTS/G difference in scoring from last season to this season, although the average in 2023 was the higher one for almost every rank comparison.
So, why is the average in WAR/G in 2024 higher? Look no further than the reduction in scoring from the quarterback and tight end positions. The slight reduction in scoring from those positions means that wide receivers are making up a higher percentage of your lineup’s points each week. This is similar to what is happening with the running backs, but the jump isn’t as high since there is not an increase in scoring from the receivers.
Tight Ends
| Rank | TE WAR/G | TE WAR/G History | TE Difference |
| 1 | 0.19 | 0.20 | -0.01 |
| 2 | 0.18 | 0.16 | 0.02 |
| 3 | 0.15 | 0.13 | 0.02 |
| 4 | 0.14 | 0.12 | 0.02 |
| 5 | 0.12 | 0.10 | 0.02 |
| 6 | 0.11 | 0.09 | 0.01 |
| 7 | 0.07 | 0.08 | -0.01 |
| 8 | 0.07 | 0.07 | 0.00 |
| 9 | 0.07 | 0.06 | 0.01 |
| 10 | 0.06 | 0.06 | 0.00 |
| 11 | 0.06 | 0.05 | 0.01 |
| 12 | 0.04 | 0.04 | 0.00 |
| 24 | -0.01 | 0.00 | -0.01 |
| 36 | -0.04 | -0.03 | -0.02 |
Now for the bane of all fantasy managers' existence, tight ends. Tight ends have been underwhelming, to say the least, so far this season. Through 3 weeks, Brock Bowers has been just about the only bright spot at the position from a consistency standpoint, with Isaiah Likely, Cole Kmet, and Dallas Goedert each having one monster game to buoy their value. The crazy thing is that there is little to no difference in their WAR/G compared to the historical baseline.
First off, 2023 was not a banner year for tight ends either, but there was solid depth with 11 players averaging over 10 FPTS/G. So far, there are only 7 tight ends in 2024 that can claim that honor. There were 31 tight ends that averaged over 5 FPTS/G in 2023, compared to only 24 this season. It has been extremely difficult to find tight ends that you can feel even remotely good about putting in your lineup.
Because of the poor depth at the position, the WAR/G is not significantly lower. Similar to the quarterbacks, with the average starting tight end points being down AND the replacement-level players being lower, tight ends are maintaining their WAR/G value.
Closing Remarks
And that is how valuable each position is so far in 2024 based on WAR/G compared to the past ten years. Running backs are the kings of the sport again, while quarterbacks and tight ends are performing at or below their historical averages. As mentioned above, there is really nowhere to go but down for running backs. Take advantage of their value now if you can!
Later on in the season, I will update these numbers to see how valuable each position is and what the changes have been.


