
This article series is a deep dive into all of the metrics that our fantastic data collection team has procured from charting every single NFL game over the last two years.
We are thrilled to offer access to our entire hub of tools to you for $200 ($50!!) for the 2023 season. The Fantasy Points Data Suite will be your go-to for NFL research – forever. Our fast filtering system displays hundreds of data points in seconds, all quickly digested into your preferred fantasy scoring system.
With the last two years of Fantasy Points Data at my disposal, I studied which stats matter the most at each position regarding fantasy football. To do this, I ran correlation tests across hundreds of metrics – seeking statistical signals.
What We’re Studying
For this study, we only want to look at fantasy-relevant running backs. To make sure part-time players don’t skew the numbers, only running backs with at least 40 carries and at least four games played were included.
This data spans the last two seasons (2021-22) — the total sample size = 158 running backs.
Fantasy scoring is Half PPR.
All correlation data is ranked by strongest (+1 | perfectly positive), weakest (0.0 | no correlation), to negative (-1 | perfectly negative).
Volume Rushing + Receiving Stats
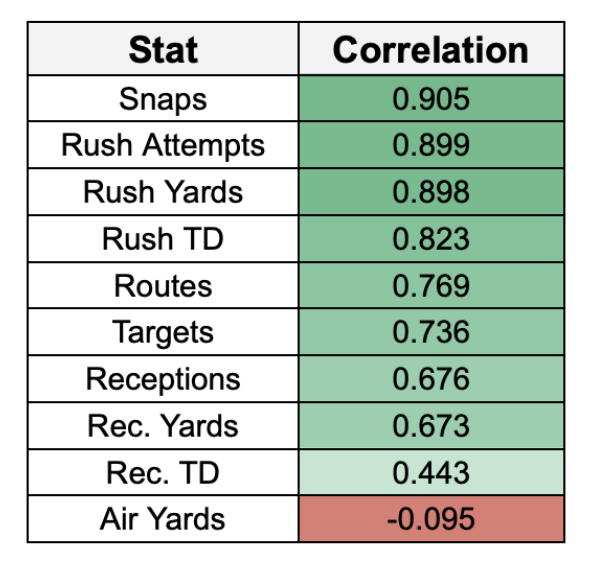
RB Usage – Rushing + Receiving Stats
At the top, we see that total snaps played correlate best to fantasy points, followed by all of the rushing stats, then targets and routes run.
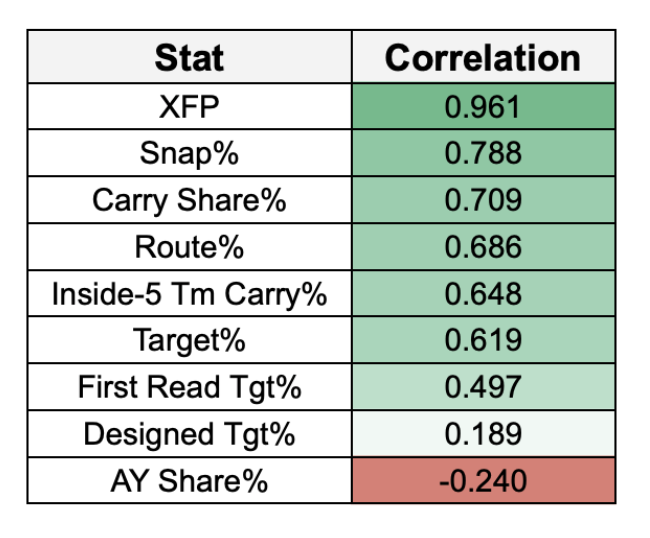
XFP is Expected Fantasy Points, which is Scott Barrett’s brainchild. XFP measures the number of fantasy points you’d expect a running back to score on a per-play basis – and that number is based on down and distance, yards from the goal line, and average depth of target. It’s the stat to use to identify positive or negative regression candidates.
Volume > everything else at running back.
This year, there are very few running backs that are true bell cows. The NFL has been shifting towards more committee-based backfields for years, and with the historic 2017 RB class starting to age out of starting roles, we’re left with very few running backs that project like league-winning bell cows.
Over the last six years, we’ve seen true three-down RBs start to decline. Conversely, this is another part of the reason we are seeing wide receivers pushed up draft boards higher while running backs’ ADP dips.
Running backs who played at least 70% of team snaps by year
2018 – 10
2019 – 8
2020 – 8
2021 – 6
2022 – 7
Last year, the seven RBs that hit the 70% threshold of their team’s snaps were: Saquon Barkley (80.5%), Josh Jacobs (75.2%), Christian McCaffrey (72.8%), Dalvin Cook (72.8%), James Conner (71.3%), Jonathan Taylor (70%), and Alvin Kamara (70%).
We hope that Bijan Robinson will be a bell cow out of the gates, but other than him, the state of high-volume RBs is in a weaker spot now than in previous seasons.
We’re definitely losing another 2017 rookie class bell cow in Dalvin Cook this year, too. Alvin Kamara is also in extreme danger of losing his bell cow role from last season after the additions of Jamaal Williams and Kendre Miller.
So with the rise of committee backfields, it’s becoming more important than ever to understand the value a particular running back brings based on their role. We can take snap data further than ever now with our Data Suite, filtering for different situations on the field.
Since touchdowns matter so much, we’ll start there.
Here’s how running backs’ red-zone snap rate – split out by inside-the-5, inside-10, and inside-20 – correlates to fantasy points…
Red-zone snap% correlation to fantasy points
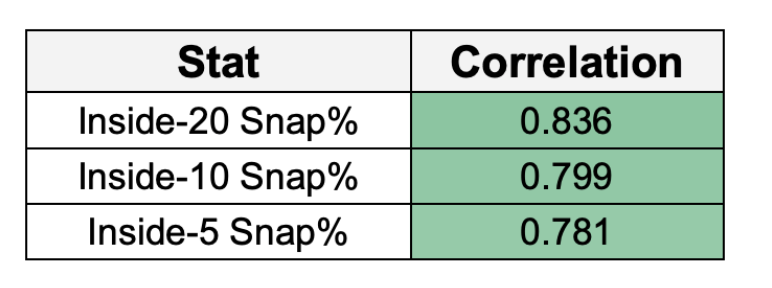
Note that red-zone snap rate marginally correlates better to fantasy points than any receiving stat – like routes (0.769) and targets (0.736).
At the end of the day, touchdowns are the great differentiator in fantasy. We can run as many projections as we’d like and dive deep into the stats, but if you’re not scoring touchdowns with some level of consistency, you’re likely very hard to trust.
The bottom line is that while touchdowns are tough to predict at a weekly level, projecting who will be on the field in scoring situations is a much easier endeavor.
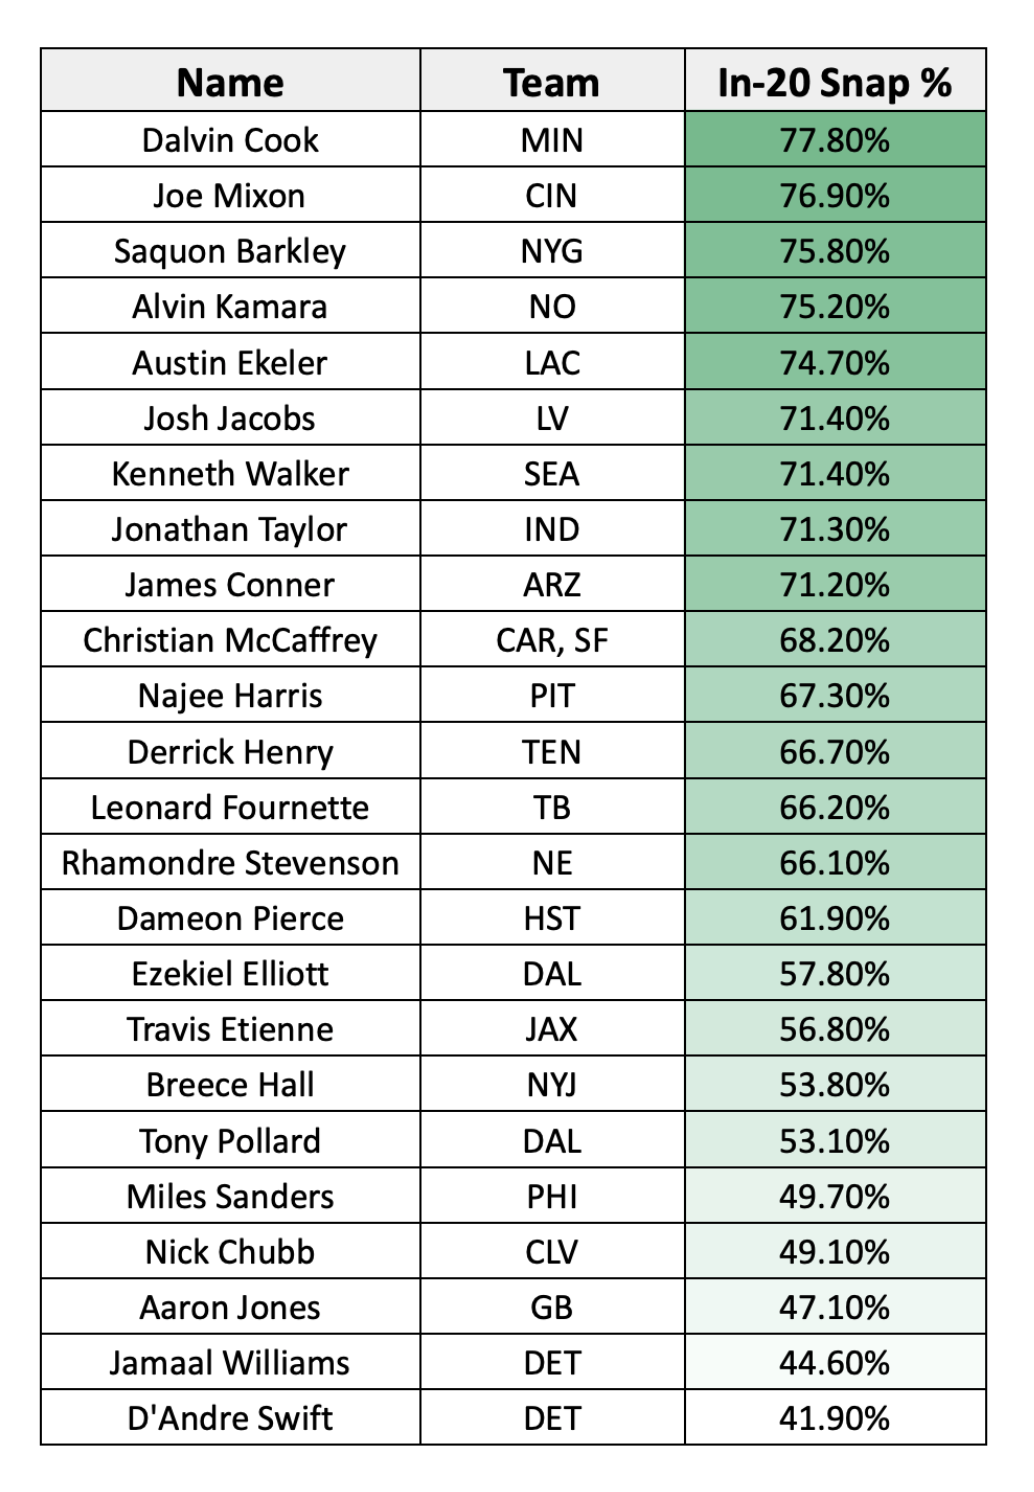
With that said, below are the leaders in inside-20 (red-zone) snap rate last season. This data only includes the game in which the player was active.
Let’s hit some takeaways…
Red-zone snap notes
Austin Ekeler got a fair amount of rest on early downs and in between the 20s last season, but he was a bell cow in the red zone. Money touches = money fantasy points. That’s what fueled his league-high 17 TDs.
Ken Walker was a bell cow in the red zone and was the only running back that got 100% of his team’s carries inside the 5 last season. How much does that change with Zach Charbonnet backing him up? Seattle only had nine total rushing plays inside the 5 last year, which tied with Houston for the league-low. That was a bit of a fluke, given how good they were offensively – so the red-zone pie should get larger, at least.
Tony Pollard has a top-3 ceiling at the position if he gets into the 65-70% red-zone snap range this season with Ezekiel Elliott gone. Pollard was RB9 by fantasy points per game, but ranked only RB29 in red-zone snap rate last season. If you give Pollard just 35% of Elliott’s red-zone role (measured by XFP) last season, it would have been enough of a bump to take Pollard from RB9 to tied for RB5 with Barkley.
Alvin Kamara got a ton of snaps last season, but scored only 4 total TDs across 15 games. Unfortunately, he likely will not get that many opportunities this season to redeem last year’s bad TD luck. Kamara’s red-zone role will fall off with the additions of Jamaal Williams and rookie Kendre Miller to go along with RB-not-TE Taysom Hill.
James Conner’s ADP (RB26 | 84 overall on Underdog) makes no sense. Arizona won’t be an offensive juggernaut, but that price is flat disrespect for Conner’s role. Conner was RB9 in snap rate inside-the-20 last season and the Cardinals now have less competition for goal-line carries than ever. Also, Conner has been a legitimately great short-yardage back in his career. Since 2018, only Derrick Henry (52.7%) has converted a higher rate of his carries inside-the-5 (goal-line) into touchdowns than Conner (52.5%) among RBs.
Note that Nick Chubb played on 49.1% of the Browns’ red-zone snaps last year while Kareem Hunt (45.5%) split a large secondary portion. Jerome Ford will be a factor, but Chubb’s red-zone role will surely expand a bit this season.
While Joe Mixon has efficiency-related red flags, he can remain a top-15 fantasy RB just through sheer red-zone volume. None of these concerns matter too much if he continues to get the highest-end end of bell cow usage in the red-zone.
Joe Mixon still has a great TD upside for fantasy. Volume > everything else. But there are some major red flags in his profile.
— Graham Barfield (@GrahamBarfield) July 15, 2023
His metrics last season via @FantasyPtsData:
* 33rd-of-33 RBs in missed tackles forced per carry (0.086)
* 32nd in YPC on zone-concept runs (2.99)
*…
Top-24 RBs by snap splits
Unlike wide receivers, running back usage can depend highly on game script.
This means that players like Derrick Henry historically score more fantasy points when their teams win football games, while other RBs like Christian McCaffrey are immune to game
script because they play a ton on passing downs when their teams are trailing.
Thanks to our Data Suite, we can filter through which running backs play most based on game script (leading and trailing).
Here are last year’s top-24 running backs (by fantasy points per game) snap splits:
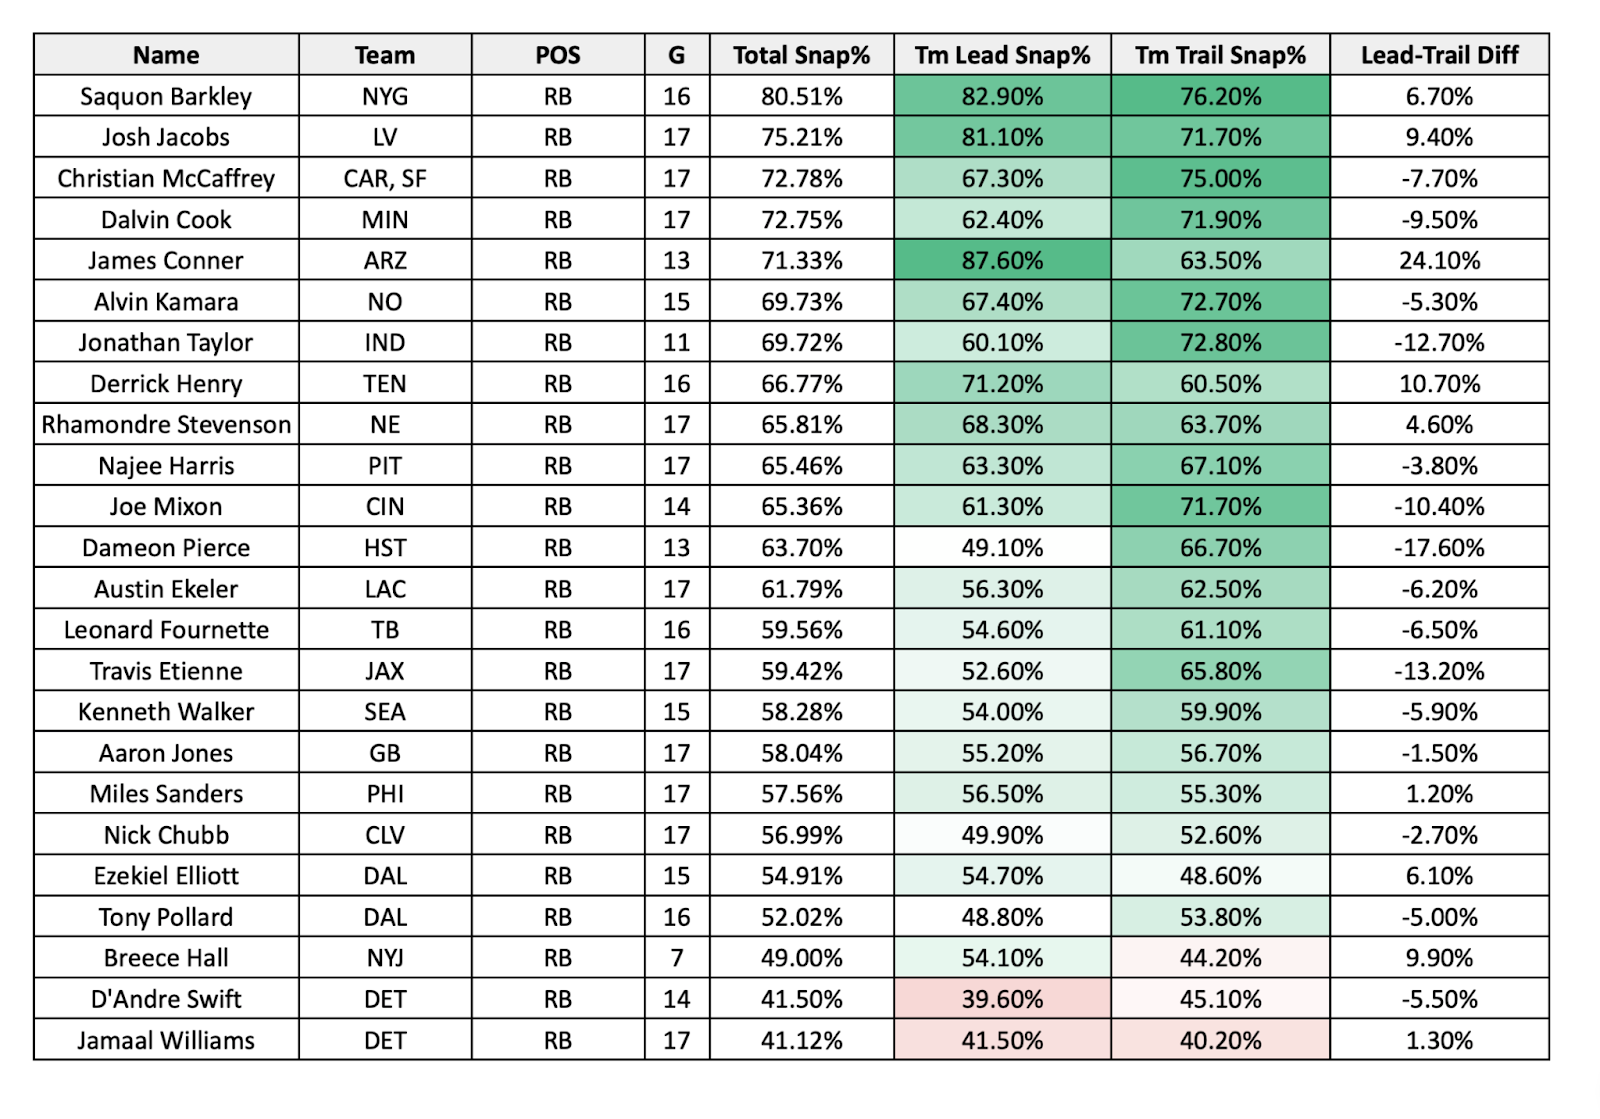
The right column is the difference between the RB's snap rate when leading vs. trailing. A positive number – like Saquon Barkley’s – means that the RB played on a higher rate of their team’s snaps when leading.
The data is sorted by descending snap rate leaders (Barkley was 1st in snap%, Jacobs 2nd, etc).
Let’s go through some notes…
Snap split notes
James Conner was a bell cow to the highest degree when the Cardinals led games – his 87.6% snap rate was first among running backs. He’s going to miss a few games like always, and the Cardinals are probably going to stink, but Conner is an incredible RB2 value at ADP.
Unsurprisingly, Derrick Henry had the second-highest difference in snap rate when the Titans were leading (+10.7%). Henry ranked fourth in snap rate when leading (71.2%) last season and ranked sixth in 2021 (70.8%).
Note that Ezekiel Elliott out-snapped Pollard when the Cowboys were leading last season (54.7% to 48.8%). I expect Pollard to join the 65% range this season.
Dameon Pierce looks massively game-script dependent by this data, but that is largely because Houston rarely led last season. Pierce played on only 55 total snaps when the Texans were ahead on the scoreboard.
Jonathan Taylor has gone from being the first overall pick to 16-18 overall in Underdog best ball drafts, which looks like a massive value if you like chasing volume. Taylor was an unsung bell cow last season, ranking third in snap rate when trailing (72.8%) – just behind McCaffrey (75%) and Barkley (76.2%). He also averaged 20.8 routes run per game, fifth-most among running backs.
Rhamondre Stevenson is right on the cusp of being a bell cow. He ranked fifth in snap rate when the Patriots had the lead (68.3%) and was just behind the elite RBs in routes run per game (17.9 | 14th-most among RBs). And his 66.1% snap rate inside-the-20 was just behind the elite RB1’s.
Joe Mixon tied with Josh Jacobs (71.7%) for seventh in snap rate when trailing last season – and now Samaje Perine is gone.
So, if volume and snaps correlate so strongly to fantasy points…
How much does efficiency matter?
I’m glad that you asked!
Let’s dive deep into the Fantasy Points Data by looking at running back’s efficiency metrics – both through the air and on the ground.
Efficiency Rushing Stats
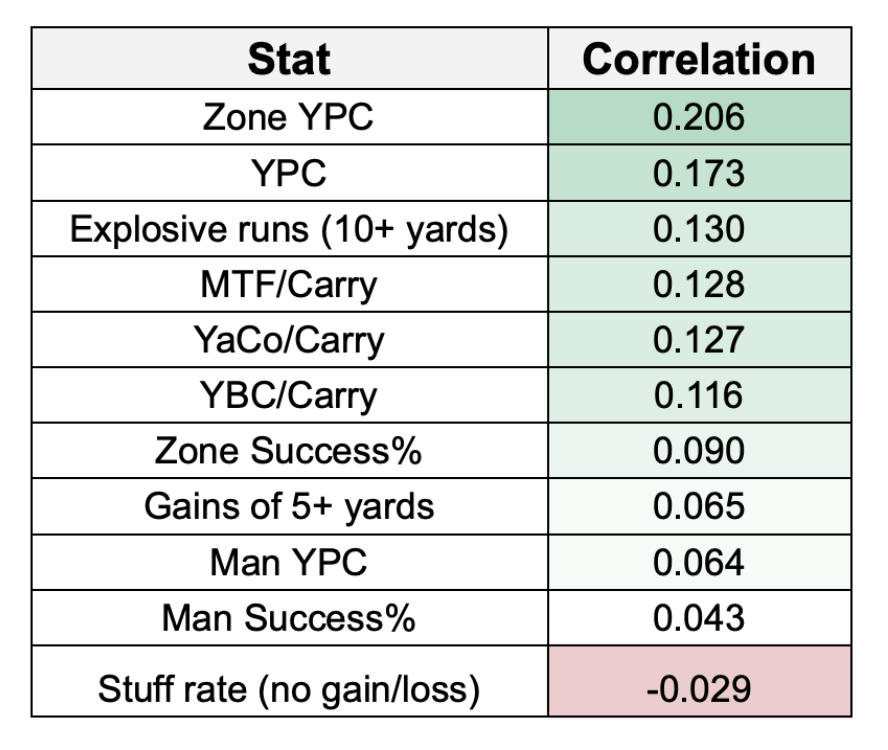
Compared to volume, well, there really is no comparison. All efficiency-related rushing stats have very limited signal regarding their relationship with fantasy points.
Because there is so much that goes into a successful run play that is out of the runner's control, we see a weak correlation across the board in rushing efficiency.
That’s not to say that efficiency doesn’t matter – it’s relatively less important than volume.
Note that yards per carry – specifically YPC on zone-blocking concepts – correlates best to fantasy points by a small degree.
We make these important blocking scheme designations in our Advanced Rushing tool.
The top-10 RBs in YPC on zone-blocking attempts last season were (min. 100 total carries):
1. Khalil Herbert (5.73)
2. Raheem Mostert (5.61)
3. Tyler Allgeier (5.18)
4. Cordarrelle Patterson (5.12)
5. Ken Walker (5.11)
6. Nick Chubb (4.92)
7. Jeff Wilson (4.87)
8. Tony Pollard (4.85)
9. Josh Jacobs (4.83)
T10. Jonathan Taylor (4.80)
T10. Isiah Pacheco (4.80)
… While the bottom-5 RBs were:
38. James Robinson (3.03)
39. Michael Carter (3.02)
40. Joe Mixon (2.99)
T41-last. Kenyan Drake (2.56)
T41-last. Leonard Fournette (2.56)
Yeah, so, this does not bode well for Mixon or Fournette!
If you want a positive spin for Mixon, he was much better on man/gap concepts (4.57 YPC-man | 19th) compared to zone, and the Bengals were predominantly a man-blocking offensive line last year (56% of Mixon’s carries were man/gap concepts).
Note how strong Falcons RBs Allgeier and Patterson were on zone runs last season. Atlanta was particularly great on outside zone runs, averaging a league-high 5.25 YPC. Allgeier actually led the NFL in yards on outside zone concept runs (786 yards) over Derrick Henry (662).
Bijan Robinson is going to be incredible in this system.
Only two RBs ranked top-10 in YPC on both zone- and man-blocking concepts last season…
The first one is obvious: Nick Chubb (4.92 YPC-zone | 5.19 YPC-man).
The second? It may be a surprise…
It’s Tony Pollard (4.85 YPC-zone | 5.75 YPC-man).
These were the top-10 running backs in YPC off of man/gap-blocking schemes last year:
1. Aaron Jones (6.33)
2. Travis Etienne (5.89)
3. Miles Sanders (5.83)
4. Tony Pollard (5.75)
5. Khalil Herbert (5.57)
6. Rhamondre Stevenson (5.53)
7. Austin Ekeler (5.25)
8. Christian McCaffrey (5.19)
9. Nick Chubb (5.19)
10. Cam Akers (5.12)
Yards after contact and missed tackles forced per-carry leaders
After YPC and explosive runs, we see that generating yards after contact and forcing missed tackles are the third- and fourth-best efficiency metrics, respectively.
Well, what do you know…
Tony Pollard (3.84) and Nick Chubb (3.52) were also the league leaders in yards after contact per carry last season.
Here are last season’s leaders in yards after contact per attempt from the Data Suite:
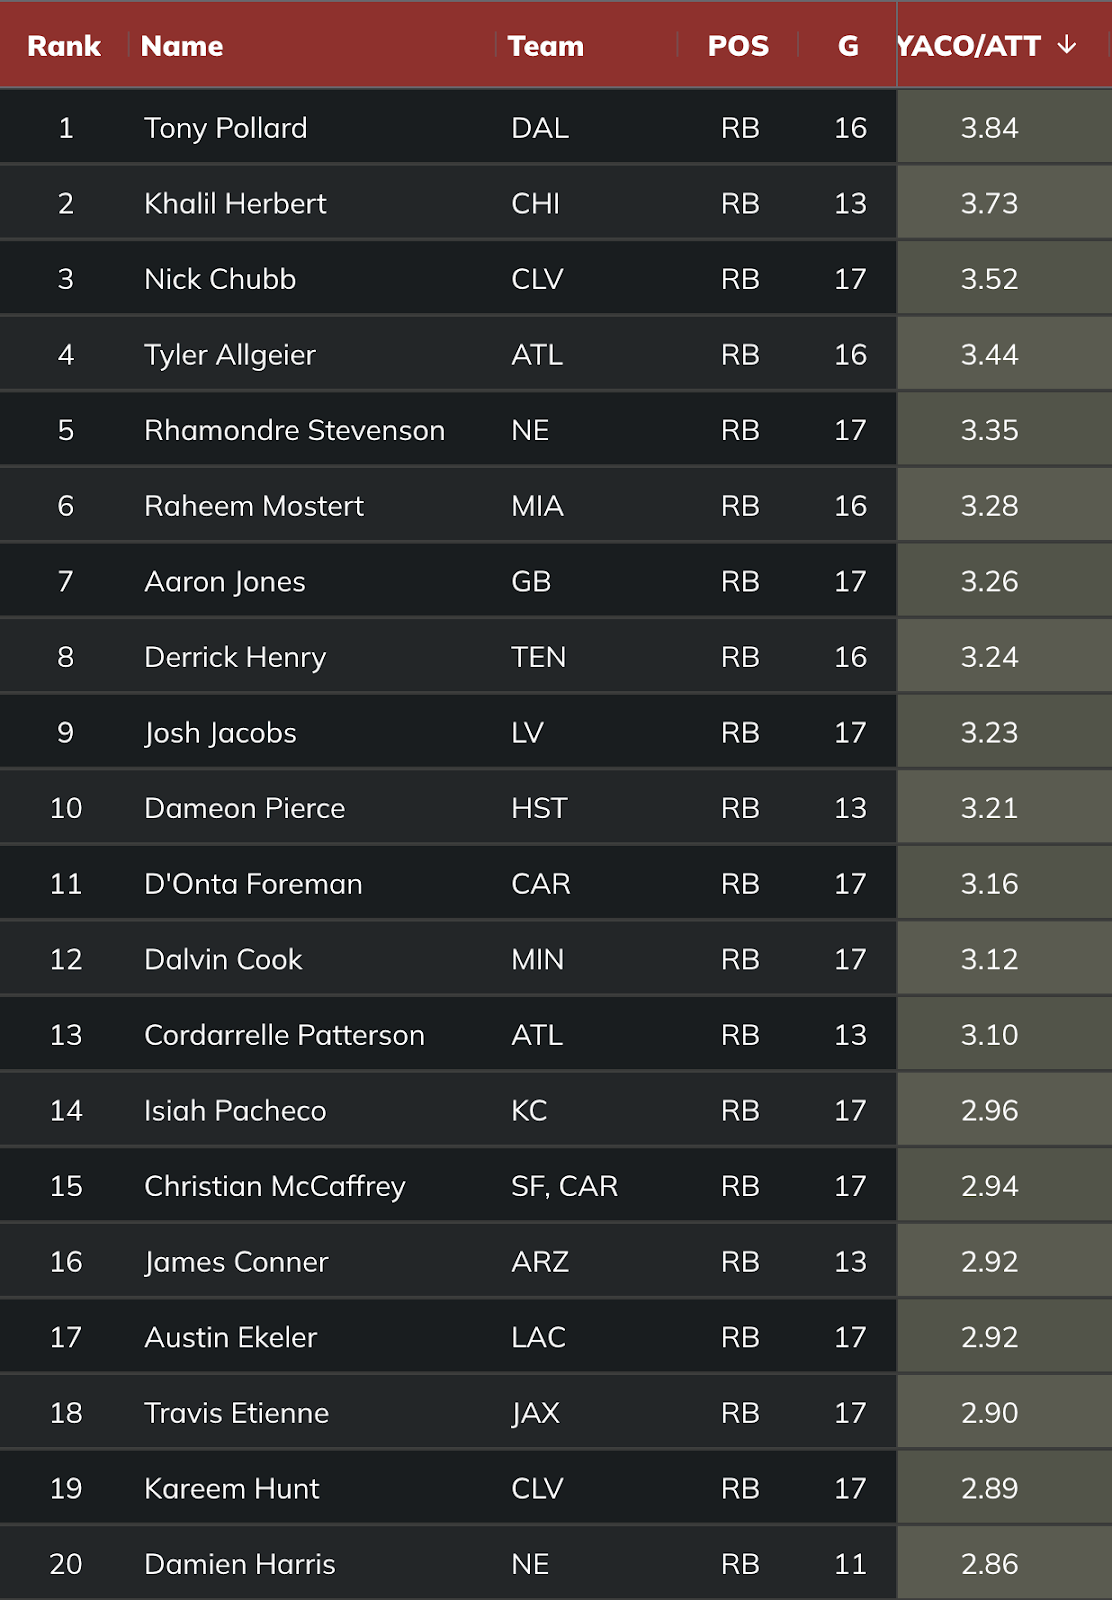
Also note how not-washed aging RBs Aaron Jones and Derrick Henry were last season.
Jones, in particular, remains underrated, and his ADP this season looks like a bargain (RB17 | 54 overall). There aren’t any skill-regression concerns with the 28-year-old Jones as there are with Mixon (27 years old) and Alvin Kamara (28).
Jones is coming off his fourth straight season in which he’s finished top-13 or better in fantasy points per game, and while Aaron Rodgers’ departure looms large, he’s still the same electric runner he’s always been last season.
Among the 42 qualifying RBs with at least 100 carries, Aaron Jones finished seventh in yards after contact and ranked fifth in missed tackles forced per carry (0.26) – behind leaders David Montgomery (0.31), Nick Chubb (0.31), and Khalil Herbert (0.29).
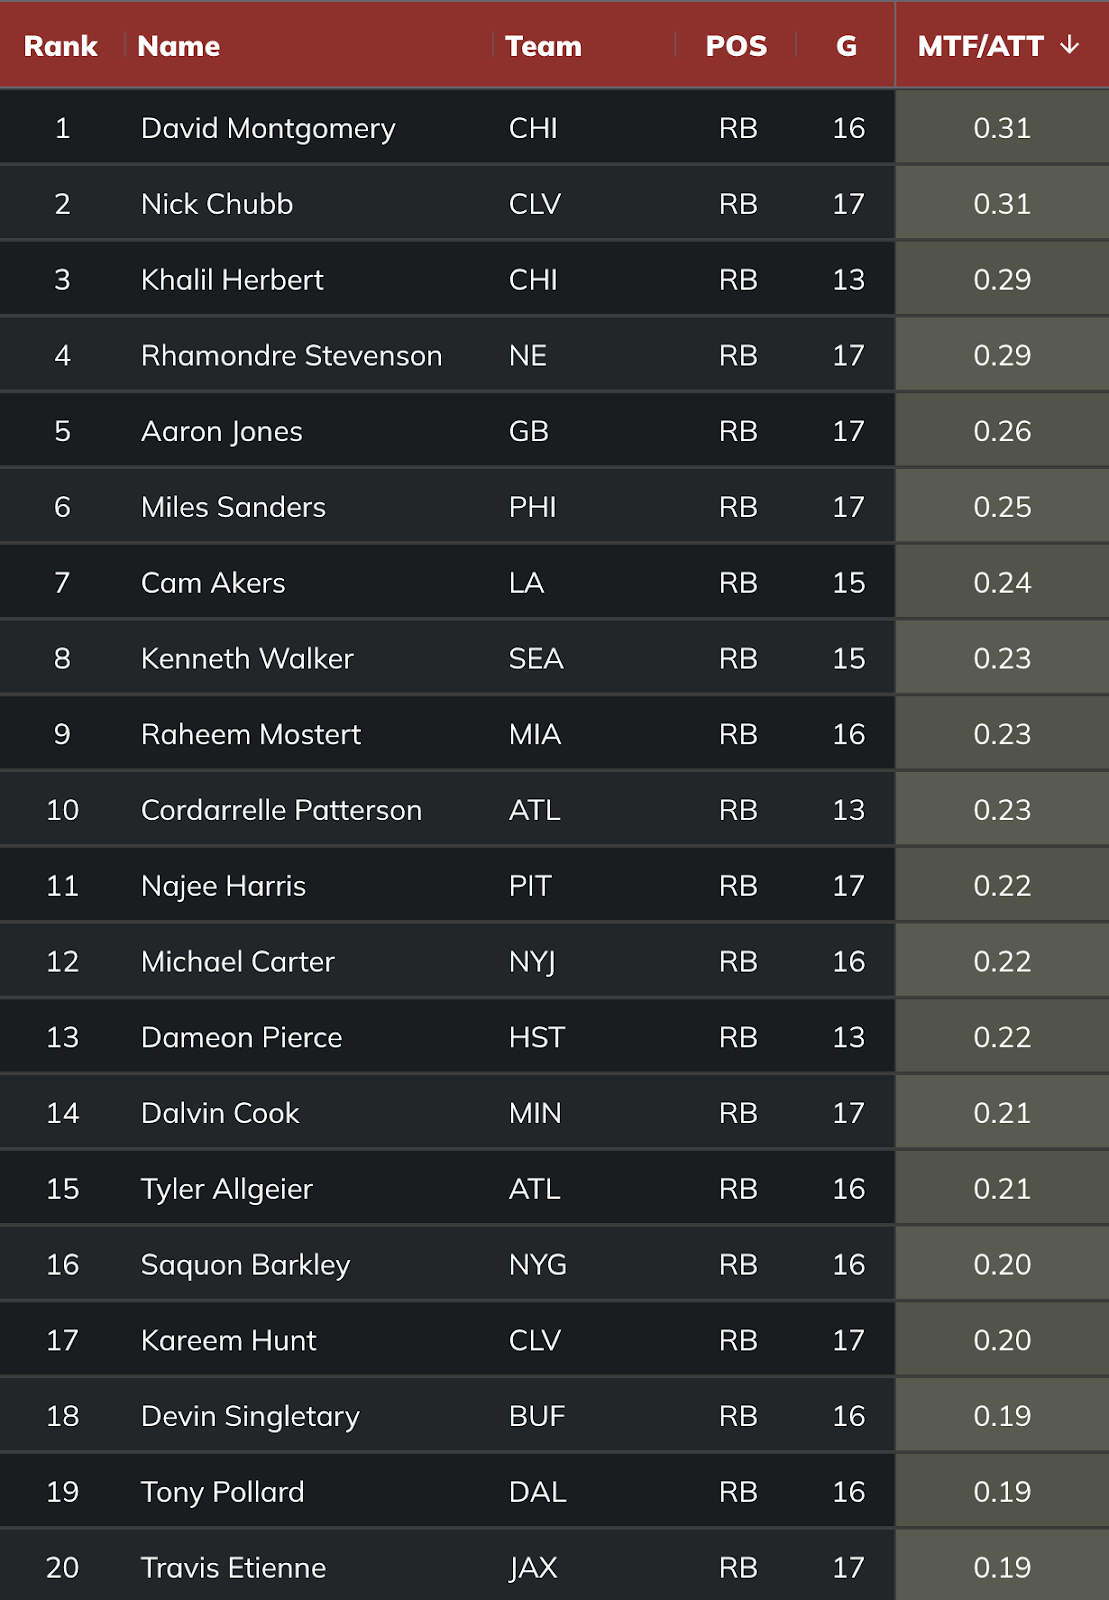
The runners that finished top-20 in both yards after contact and missed tackles forced per carry were:
Nick Chubb
Rhamondre Stevenson
Aaron Jones
Dameon Pierce
Tony Pollard
Travis Etienne
Raheem Mostert
Khalil Herbert
Tyler Allgeier
Note that Najee Harris was 11th in missed tackles forced (0.22 per carry), which contradicts the popular narrative that he’s a volume-based plodder. Harris also dealt with a foot injury (Lisfranc) that he sustained in August of last year that likely kept him at less than 100% for much of the season.
Harris needed to be elusive, because the Steelers' offensive line gave him bottom-5 blocking.
Najee averaged 1.12 yards before contact per carry, which was fourth-lowest behind Dameon Pierce (1.05), Michael Carter (0.99), and Kareem Hunt (0.91).
I’m a little concerned that Devin Singletary will eat into Dameon Pierce’s role as a receiver, but it’s clear that Pierce is a baller. He ranked tied for 12th in missed tackles forced and 10th in yards after contact per carry last season despite having terrible run-blocking.
Pierce is an excellent fit in new OC Bobby Slowik’s zone-based scheme and was more effective in zone last season, averaging 4.43 YPC with a 49.5% success rate vs. 4.1 YPC (45.9% success) on man/gap blocking concepts.
Efficiency Receiving Stats
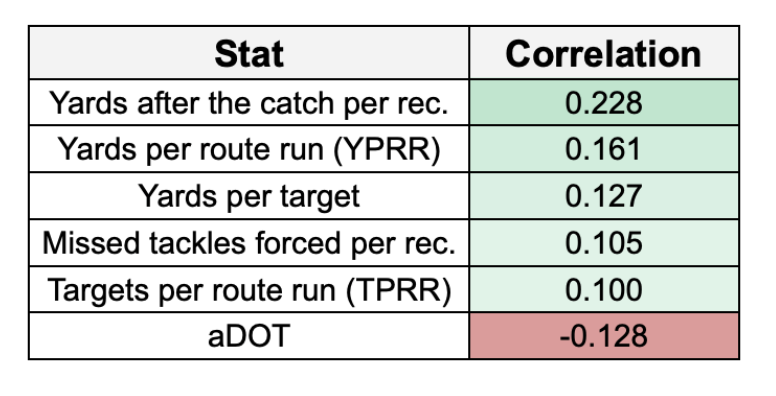
Just like with rushing stats, we see that most receiving efficiency stats just pale in comparison to volume. Once again, the focus should be way more on usage – routes and targets – than efficiency.
Off the top, we see that yards after the catch is the clear best efficiency stat for running backs in the pass game. Which makes sense!
Here are the top-20 leaders in yards after the catch per reception last season:
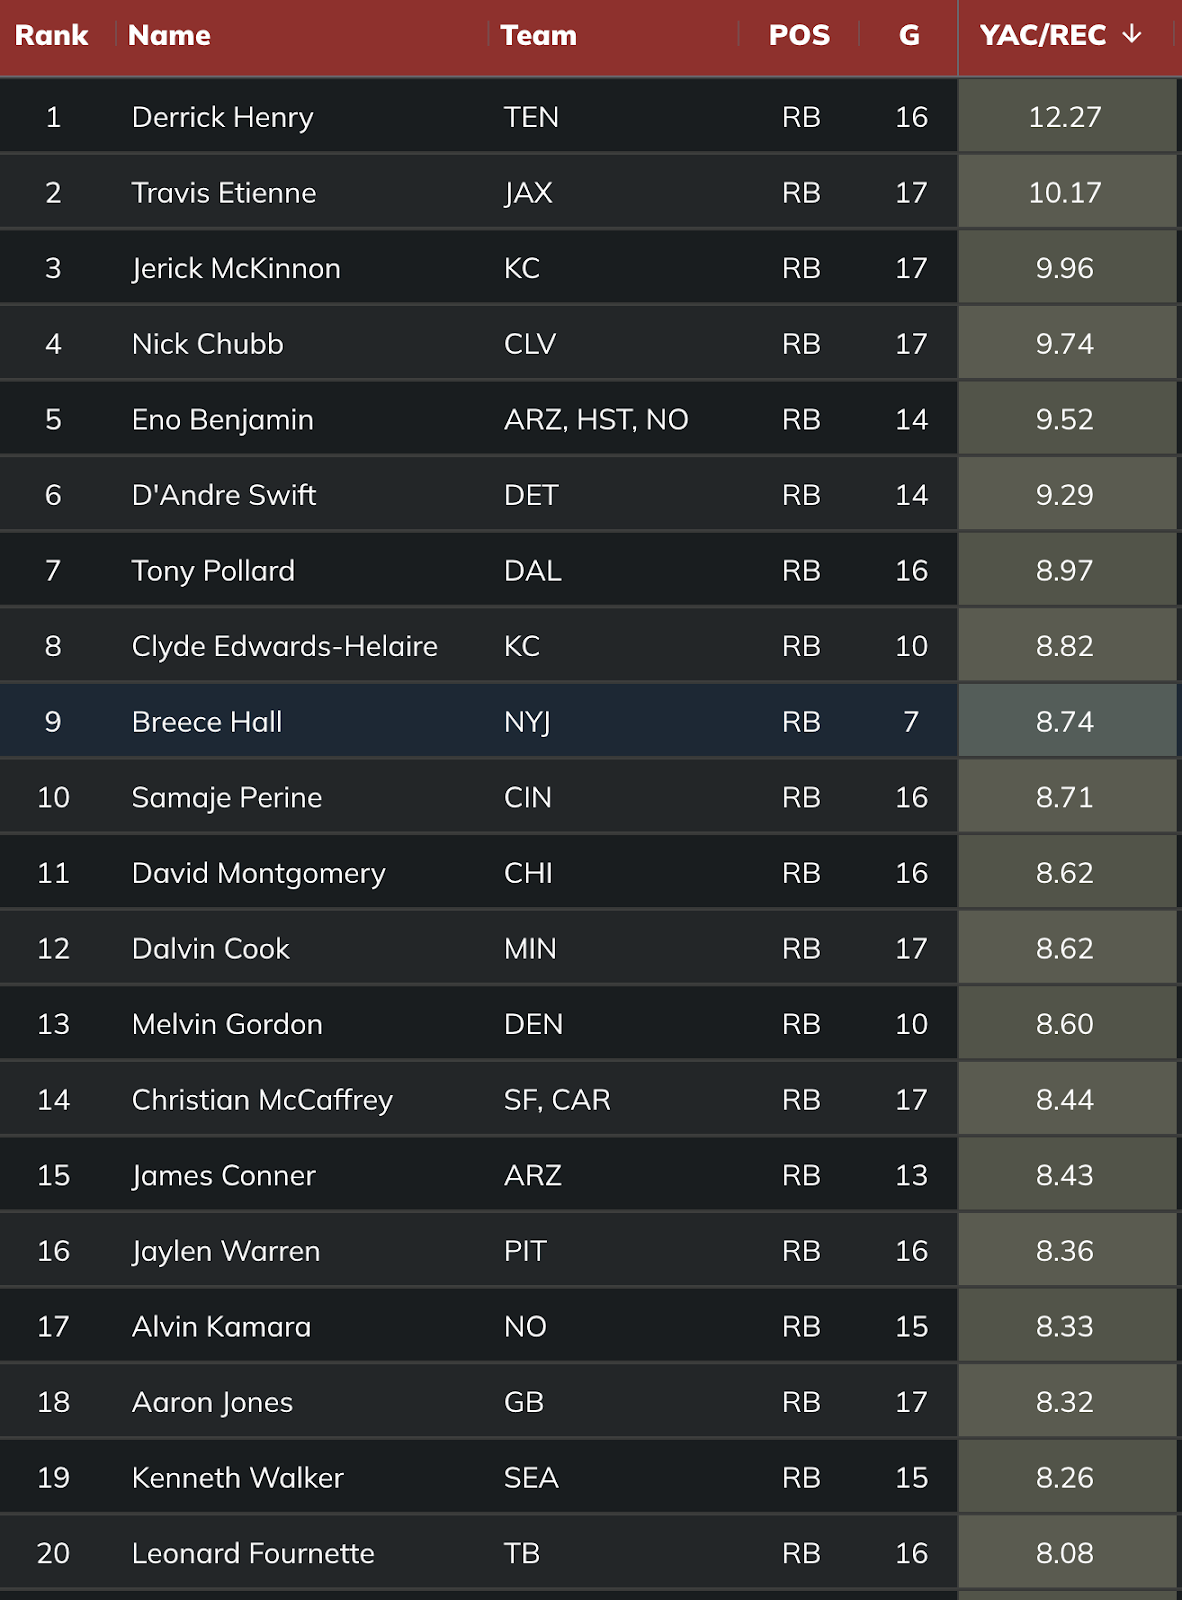
Derrick Henry set career-highs across the board in targets, receptions, and yards – largely due in part to the Titans finally getting him involved in the screen game.
In fact, 37.5% of Henry’s targets were on designed pass plays – like screens – which was the third-highest rate among running backs behind Travis Etienne (44%) and Aaron Jones (41.7%).
While it was very impressive that Travis Etienne totaled over 1,400 scrimmage yards in what amounted to his rookie season, he has been miscast by Twitter as a pass-down savant. That has never been his calling card.
When I charted Etienne for Yards Created, I noted that 74% of his receptions came on three routes – screens, flat routes, and block/release checkdowns. Etienne did not run complex routes in college and was schemed most of his targets last season. For fantasy, we will have to live with the fact that Etienne will live in the 35-45 receptions range.
Nick Chubb is an absolute beast after the catch off of screens and he has untapped upside for fantasy with an increased role in the passing game likely to come. Chubb ranked fourth in yards after the catch (9.74) last season and was a strong 10th in the 2021 campaign (9.40 YAC/reception).
We have an eight-game sample (from 2019) before Kareem Hunt joined the team when Chubb averaged what was easily a career-high 3.1 receptions per game. If he can catch close to 40-45 passes this season, that could legitimately give him the RB1 ceiling with his dominance on the ground and TD upside.
Breece Hall was off to a fantastic start to his rookie season, especially as a receiver. Among running backs with 20 or more targets, Hall’s 0.57 missed tackles forced per reception easily led the league.
Here’s the top-20 list of missed tackles forced per reception leaders:
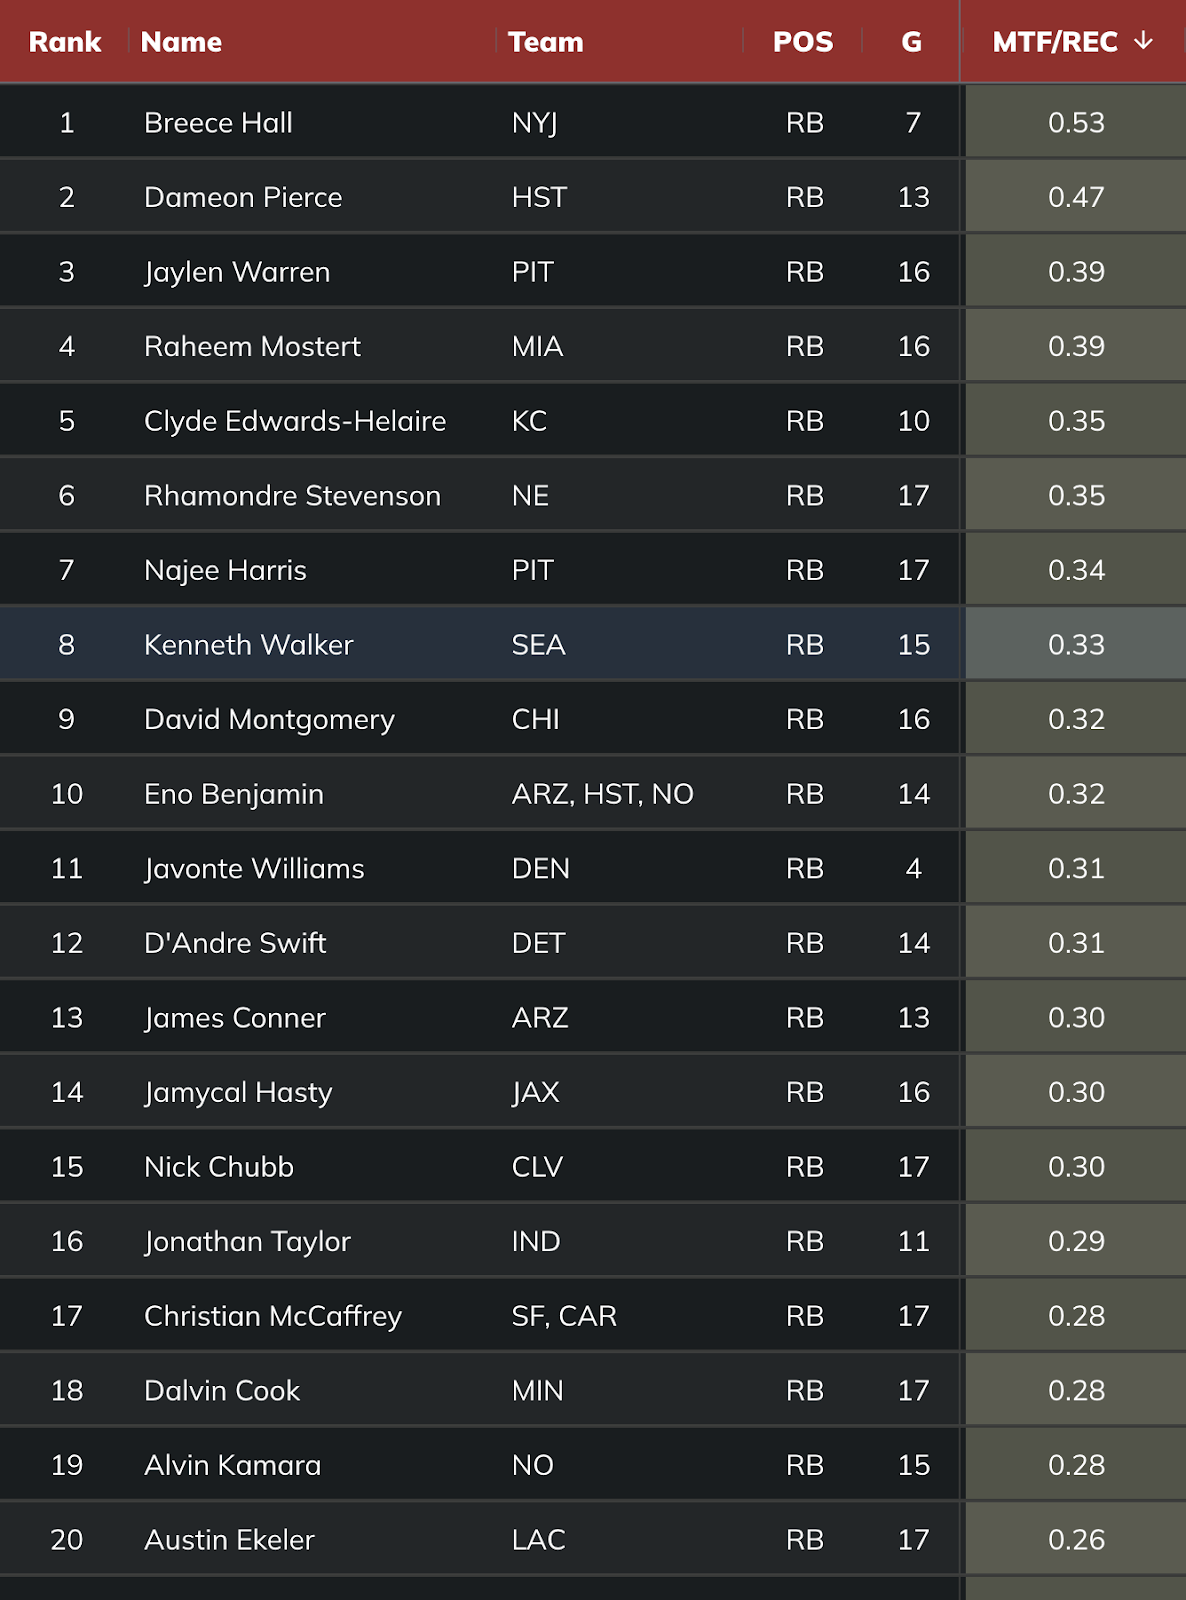
Not enough can be said about how good Rhamondre Stevenson is at shaking defenders. Ranking fourth in missed tackles forced per carry (0.29) and sixth on a per-reception basis (0.35) is extremely impressive. Stevenson will greatly benefit from having an actual offensive coordinator with expertise this season. The Patriots' ground game was the worst it has ever been in the Belichick era last year – to no fault of Stevenson.
Similarly, David Montgomery was awesome last season from a missed tackles forced perspective – tying Chubb for first on the ground (0.31 per carry) and ranking 9th by MTF/reception (0.32). We will see Montgomery’s efficiency spike this season as he runs behind the best offensive line of his career in Detroit.
The RBs that ranked top-20 in both yards after the catch and missed tackles forced per reception were:
Derrick Henry
Nick Chubb
D’Andre Swift
Breece Hall
Christian McCaffrey
David Montgomery
Alvin Kamara
Dalvin Cook
While Kamara still was a great receiver out of the backfield last season, his efficiency on the ground has nose-dived over the last two seasons
Among runners with at least 200 carries, Kamara ranks 38th-of-46 RBs in yards after contact (2.56 per carry) – which is a big drop from the first four seasons of his career (3.05 YAC/carry). Ideally, the Saints likely want Kamara back down in the 180 carries range this season after he’s tallied 240 and 223 carries in the last two years.


