Receivers who earn the most targets score the most fantasy points — that’s the closest thing fantasy football has to an iron law. But today, I want to investigate the exceptions to that rule, and in doing so, uncover some of the best values currently available in 2024 fantasy drafts.
We’ll accomplish this by exploring one of the most powerful but widely misunderstood stats the Fantasy Points Data Suite has to offer: catchable targets.
We’ll start at the team level before moving on to individual receivers, tackling some popular misconceptions and digging deeper into the importance and high variability of deep targets along the way.
Finally, my biggest fantasy football player recommendations stemming from this research are at the bottom of this article. This will read best straight through as written, but I understand this is a lengthy one, so I’ve included sub-headers to help you quickly find whatever you may have clicked on this article for. Here’s the TL;DR:
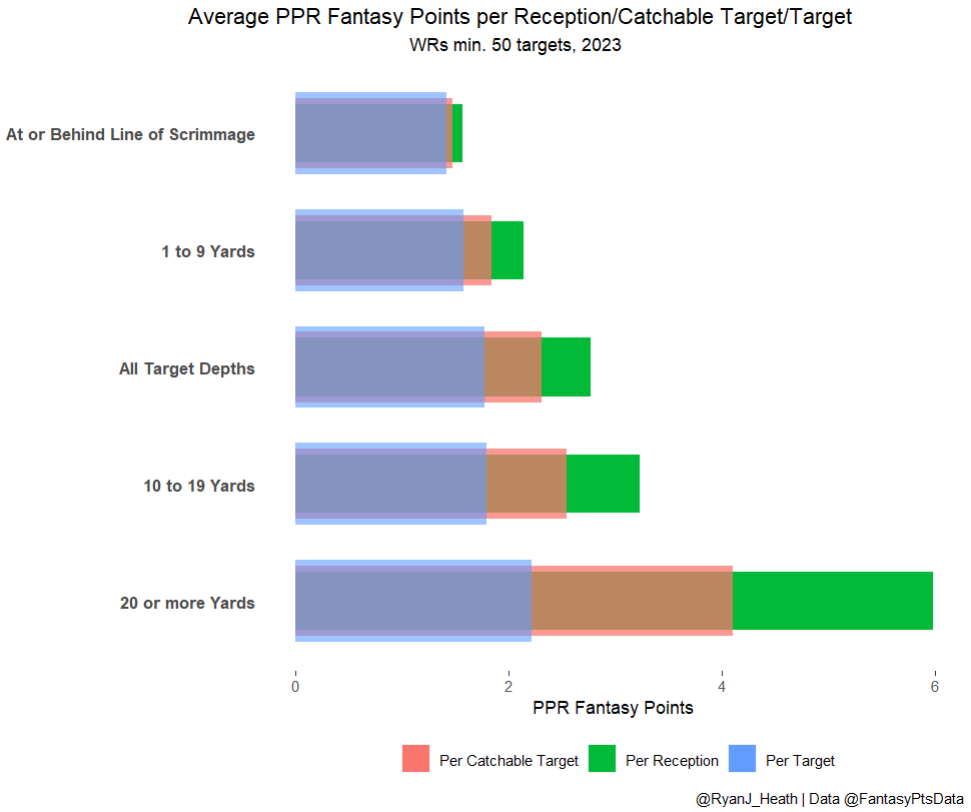
A target for WRs in PPR leagues is worth about 1.78 fantasy points on average. But a catchable target is worth about 2.31 fantasy points. The difference is even more dramatic on deep targets.
At the team level, catchable targets are more closely related to overall receiving yardage than regular targets. This is great news for Falcons receivers, as Kirk Cousins’ Vikings have averaged +50% more catchable targets/game than the Falcons over the past two seasons.
Average depth of target (aDOT) is the biggest determiner of a WR’s catchable target rate.
Still, we can expect a player’s catchable target rate (especially on deep targets) to vary significantly from year to year. When we adjust for aDOT, we can find positive regression candidates and exciting fantasy values.
Takeaways from Team-Level Catchable Targets
When projecting which offenses will produce great fantasy football players, a team’s catchable targets are an under-discussed wrinkle. Defined and charted simply as “targets on which the QB gave the receiver a chance to catch the ball,” considering only these targets that have a realistic chance to turn into fantasy points gets us closer to the reality of what is happening on the football field.
A lack of catchable targets indicates poor general QB play, which correlates with offenses that can’t move the ball, sustain drives, advance into the red zone, and score. Teams with a large number of catchable targets do the opposite, providing ample opportunities for their receivers to score fantasy points. At the team level, overall receiving yards correlate more to catchable targets (0.68) than regular targets (0.60).
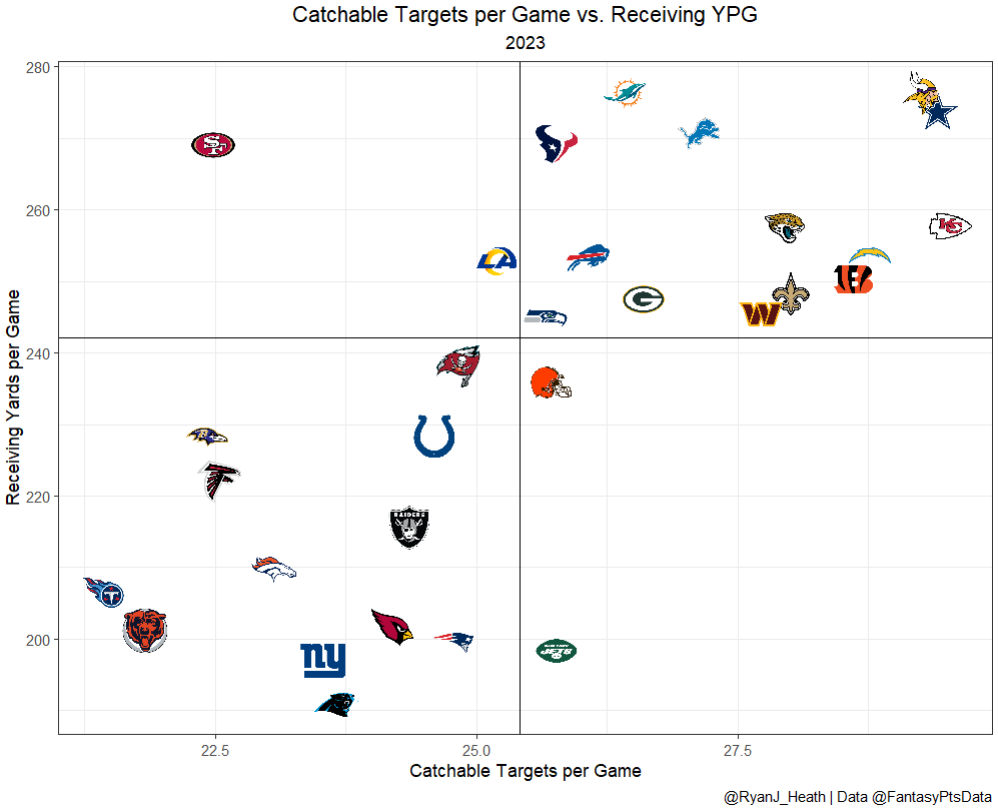
Drafting WRs in fantasy football is easy — just be better than the market at predicting which teams will and won’t inhabit the bottom-left of the above graphic in 2024. If the market incorrectly believes a QB will struggle to deliver catchable passes (as with the Texans and Packers last year), at least one pass catcher on that team will be an incredible fantasy value.
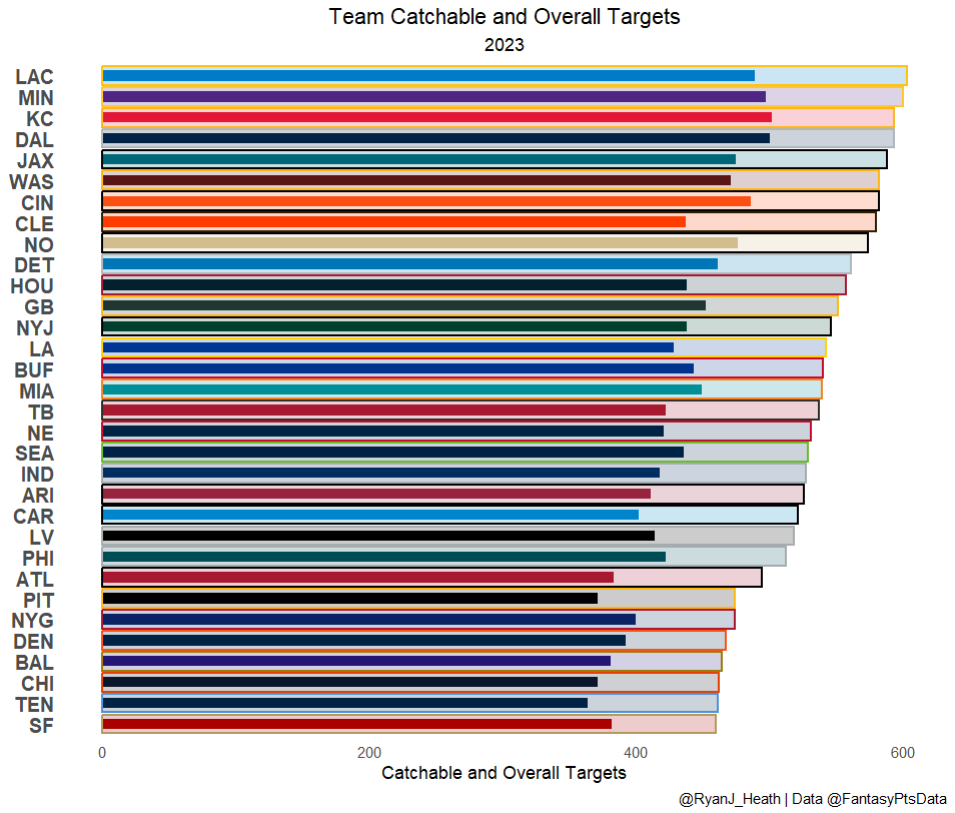
Let’s go even further. When comparing catchable targets to overall targets on the team level, it becomes obvious some offenses are more ripe with fantasy potential than others.
Taking catchable targets into account, a 15% target share on the Cowboys was worth more than a 20% target share on the Steelers last year. With former Falcons HC Arthur Smith now poised to run a similarly slow-paced and run-heavy offense in Pittsburgh, I find it hard to buy into any of their pass-catchers like George Pickens and Pat Freiermuth.
The Browns ranked 8th in overall targets but just 15th in catchable targets. Teams like the Saints, Packers, Dolphins, and Bills threw less but offered more opportunities for their receivers to score fantasy points. This makes Amari Cooper’s 2023 production even more impressive in context, observable by removing the impact playing with UFL-level QBs had on his season-long averages.
The Chiefs led the league in catchable targets per game but ranked just 7th in receiving yards per game (above). This points to the lack of weapons Patrick Mahomes had at his disposal in 2023, and suggests all pieces of this rejuvenated offense (which added Marquise Brown and Xavier Worthy) could be fantasy values. Brown in particular has lost the most fantasy points to uncatchable targets over the past three seasons.
As usual, the Shanahan coaching tree breaks all the rules, punching well above their weight in receiving production despite keeping overall pass volume relatively lower. The Texans, 49ers, and Dolphins each ranked top 6 in receiving yards per game last year despite ranking outside the top 10 in overall targets. There are several potential reasons for this best outlined in the footnotes of Scott Barrett’s recent article detailing the fantasy impact of playcallers, but in the case of the latter two teams, ranking top 7 in catchable target rate (making the most of every throw) appears a significant factor.
Impact of Catchable Targets for Individual Receivers
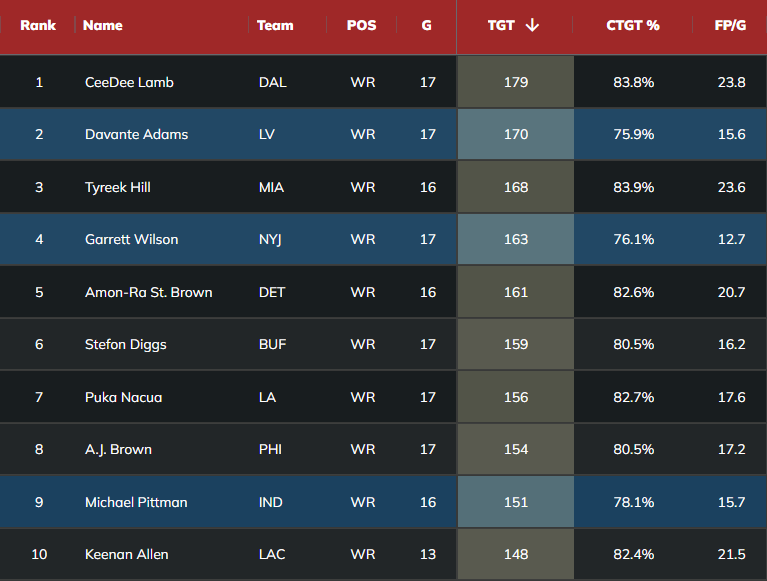
The impact of catchable targets remains apparent when we zoom in from the team level to the individual. Despite ranking top-10 in total targets, none of Davante Adams, Garrett Wilson, or Michael Pittman averaged even 16 FPG (~WR15). Noticeably, each of the trio had a catchable target rate (CTGT%, the proportion of their targets where they had a chance of making the catch) below 80%.
On the surface, this is an easy train of logic to follow — just like at the team level, fewer catchable targets should mean fewer fantasy points than overall target numbers may imply. In fact, for WRs in PPR leagues, a target is worth about 1.78 fantasy points on average. But a catchable target is worth about 2.31 fantasy points.
Additionally, the value of catchable targets massively increases on those deeper throws. A catchable deep target (coming 20 or more yards downfield) is worth 4.11 PPR fantasy points on average, nearly 2x the average catchable target (2.31).
Even more strikingly, average depth of target (aDOT) is a strong predictor of catchable target rate. This is also intuitive — WRs who get their targets further downfield (requiring a more difficult throw from the QB) naturally tend to have lower catchable target rates. In 2023, only 54% of targets coming 20 or more yards downfield were catchable, compared to 86% between 1 and 9 yards. Any worthwhile discussion on catchable targets must take this into account… which is why I created depth-adjusted catchable target rate.
With @FantasyPtsData, I created a quick stat:
— Ryan Heath (@RyanJ_Heath) June 15, 2024
Catchable Target Rate over Expected
By applying expected catchable target rates based on target depth (using bucketed distances)...
I removed the impact of aDOT on catchable target rate.
See below who actually had the worst luck: pic.twitter.com/p7eAEhMgKk
Darnell Mooney, Marquise Brown, Demario Douglas, and Diontae Johnson jump out as especially unlucky WRs whose fortunes could improve after receiving new playcallers and QBs in 2024. This makes all four of them very interesting as positive regression candidates this year, with Brown the only one carrying an ADP where this angle is arguably priced in.
Instead of using the complicated method above, we could also simply focus on deep targets. I’ll explore this below.
Addressing Misconceptions about Catchable Targets
If you’ve been skimming up to now, just understand these two points from above before proceeding:
- Catchable target rate is most impactful on deep targets. A deep target being catchable or not causes the biggest swing in either direction to a player’s fantasy points.
- A player’s catchable target rate is largely a consequence of their aDOT. Those two stats have a -0.46 correlation for WRs over the past three years. Depth may have an even larger impact than QB play (a WR’s and his team’s catchable target rate have just a 0.38 correlation).
Armed with this knowledge, we can attack two common misconceptions about catchable targets. In doing so, we’ll reveal one of the most powerful ways to use the stat to identify upside in fantasy football.
Misconception #1: “Receivers are meaningfully responsible for their catchable target rates because getting good separation makes it easier for the QB to deliver a catchable target.”
We can test this in a few different ways — most directly, by comparing catchable target rate to a separation metric like ESPN’s Open Score, which measures the ability of WRs to… well, get open. If the premise were true, we’d expect to see a sizable correlation between Open Score and catchable target rate.
Receiving open scores via tracking data and charted catchable target rates. pic.twitter.com/V2I16gVT5U
— Football Insights 📊 (@fball_insights) February 3, 2024
…but as you can see, the two stats do not appear related at all. Players like DeAndre Hopkins, Diontae Johnson, Tank Dell, Garrett Wilson, and Chris Godwin (a group with relatively varied aDOTs) had dreadful catchable target rates despite excellent Open Scores. I found a correlation of just 0.17 between the two stats for 2023.
Furthermore, if receivers “owned” their catchable target rates, we would expect them to be much more stable from season to season. Among WRs over the past three years, catchable target rate had a year-to-year stickiness of just 0.40, less stable than its biggest cause (aDOT, 0.57), and less stable than notoriously volatile stats like touchdowns. For more perspective, when we say “targets are earned,” we’re referring to a significantly stronger 0.76 year-over-year correlation for target share.
(This debate goes slightly deeper for those interested, but for our purposes here, just understand that plenty of WRs who are very good at getting open still see poor catchable target rates.)
Whether a target is catchable or uncatchable, the receiver did enough to earn a target on that play. The execution of the throw’s placement is largely on the QB, not the WR. Even if we were to grant that a receiver’s skills impact his catchable target rate, comparing the Pearson correlations I’ve mentioned throughout this section makes it clear that his aDOT and his QB’s accuracy each matter at least as much.
What if we bring deep targets into this? Among qualifying WRs with at least 15 deep targets in back-to-back seasons, their deep catchable target rate was only about 55% as sticky as their overall catchable target rate.
In other words, catchable deep targets are subject to significantly more variance (in addition to being 2.78x more valuable than a catchable target behind the line of scrimmage), meaning we may want to target players who got particularly unlucky on them last year.
Misconception #2: “If a QB hurt a receiver via a poor catchable throw rate in one season, he is likely to do so again in the following season.”
Whenever I mention Christian Watson’s catchable target rate, I’m inundated with replies snarkily asking whether the Packers traded away Jordan Love. Consider this my detailed response.
As I just argued, we should truly be focusing on the all-important catchable deep targets. So, for us to write off a player like Watson as doomed to always suffer at the hands of Love, we’d have to demonstrate that a QB’s catchable deep throw rate in one season is predictive of his catchable deep throw rate in the following season.
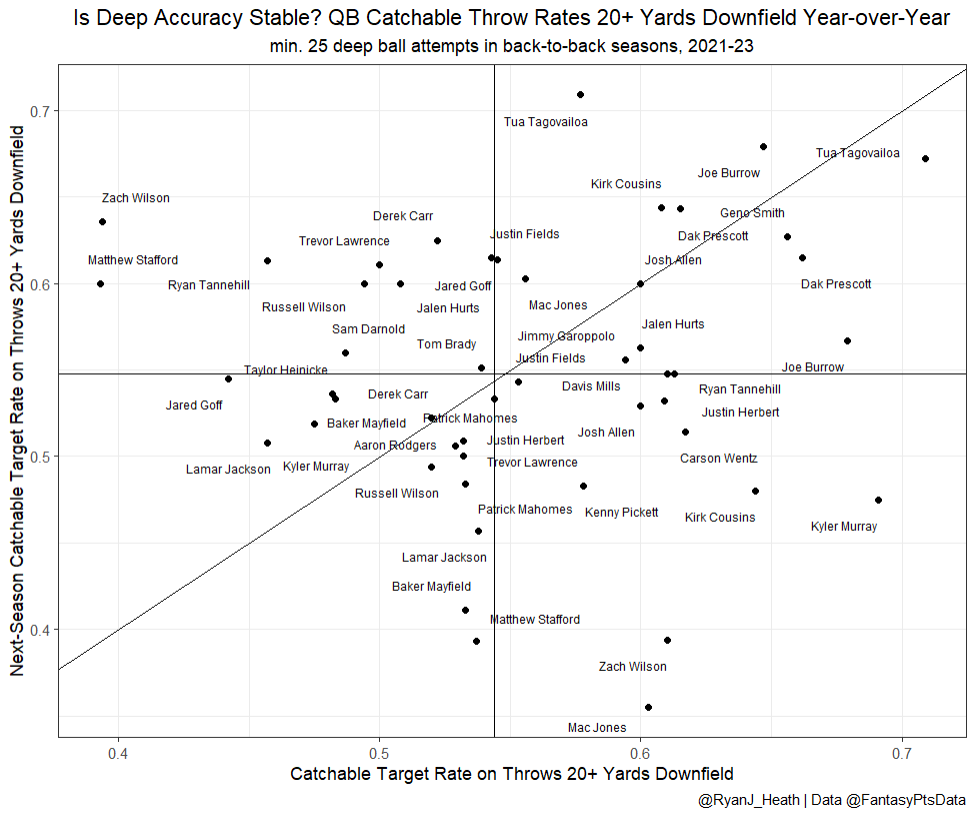
To make that easy for us, I took all 49 instances of a QB attempting at least 25 deep passes in back-to-back seasons over the past three years. Then, I put each QB’s catchable deep throw rate on the x-axis and the same QB’s catchable deep throw rate in the following season on the y-axis. If catchable deep throw rate were stable, we’d expect to see the dots below tightly clustered around the diagonal line.
However, we see the opposite — a QB’s catchable deep throw rate in one year is not at all predictive of his catchable deep throw rate the following year. The Pearson correlation is just 0.03 — virtually nothing. A variety of factors (such as pressure) could affect big changes in a QB’s catchable deep throw rate from year to year, but the biggest reason may be that there’s too small a sample size for a QB’s catchable deep throw rate to stabilize in just one season. This means we should expect catchable deep target rates to regress sharply (or essentially randomize, if you prefer) from year to year.
Uncatchable Deep Targets and Regression Candidates
Though too infrequent for a QB’s rates to be stable, uncatchable deep targets have a seriously large impact on certain WRs.
Uncatchable Deep Targets (UDTs) rob receivers of chances to make big plays.
— Ryan Heath (@RyanJ_Heath) July 2, 2024
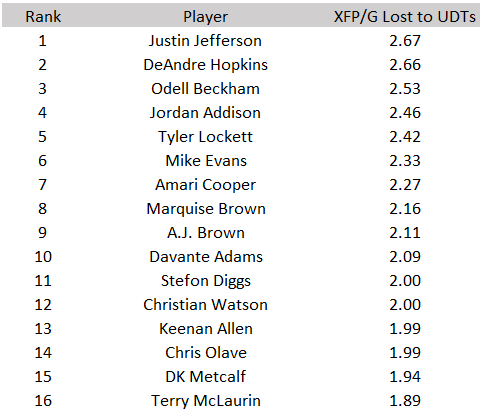
Since 2021, these WRs have lost the most expected fantasy points/game to UDTs (min. 30 games).@FantasyPtsData pic.twitter.com/fJFcdnO1W3
How should you read this? If Marquise Brown had exactly league-average luck and efficiency on just his uncatchable deep targets, he’d have averaged about 2.4 more PPR fantasy points per game since 2021. A similar role for him this year with Patrick Mahomes as his QB would have clear weekly and season-long upside.
By the same logic, Chris Olave could have averaged about 2.1 more PPR fantasy points per game over his career. That would have improved his finish last year from the WR19 to the WR11. However, Olave is mostly on the above list due to the sheer volume of deep targets he’s earned; his 53.6% catchable deep target rate last year was only a hair under the league average (54%), suggesting he wasn’t particularly “unlucky.” That’s still a sign he has excellent upside, but you’d be hoping he’ll run hot this year rather than being a true “positive regression” candidate.
On the other hand, Stefon Diggs got very unlucky, with just a 33.3% catchable deep target rate last year. Considering the significant discount his WR23 ADP gives to his recent production and his still-excellent peripherals, suggesting an age-related decline may not be imminent… Diggs is likely a value as one of the better positive regression candidates we could ask for.
Stefon Diggs' catchable deep target rate:
— Ryan Heath (@RyanJ_Heath) July 4, 2024
2021: 60.7%
2022: 60.0%
...
2023: 33.3%
(@FantasyPtsData)
This along with @dwainmcfarland's recent piece has me moving back towards being in on Diggs. https://t.co/gPSizhhJfl
To aid my analysis below, here’s the same list of players with the most XFP/G lost to uncatchable deep targets for just 2023. In the next section, I’ll highlight more players I believe fall into the Diggs category rather than the Olave category; WRs we can expect to be significantly better for your fantasy team in 2024 even without needing to get particularly lucky.
Players to Draft Based On Catchable Target Regression
In the interest of efficiently giving you actionable fantasy football advice in an article that’s already at 2,600 words and counting, I’m providing bulleted takeaways for players who stick out as values based on the several methods of analysis described above. As a slightly more verbose offering, I wrote full blurbs for several players in my Must-Draft WRs and Must-Draft TEs articles. If you skipped down to here, you will also want to CTRL+F “Marquise Brown,” “Darnell Mooney,” “Demario Douglas,” “Chris Olave,” and “Stefon Diggs” for some relevant takeaways in the previous sections of this article.
Christian Watson, WR, Green Bay Packers
2023 Catchable Target Rate: 3rd-worst, 2023 FPG Rank: WR42, 2024 ADP: WR46
Despite Jordan Love outplaying Aaron Rodgers in his first season as a starter, Watson’s catchable target rate fell from 76.9% to 67.9% (3rd-worst among 81 qualifying WRs).
Even after considering the types of targets he was getting, Watson’s catchable target rate still ranked 9th-worst when depth-adjusted.
Watson lost 2.0 XFP/G to uncatchable deep targets (12th-most). That’s partly due to just a 46.7% catchable deep target rate (8th-worst among 46 qualifying WRs).
Even when he had a step or more of separation on deep targets, Watson’s catchable target rate was just 20%.
75.0% of teammate Romeo Doubs’ deep targets were catchable (4th-best). Jordan Love is capable of delivering accurate passes downfield; his targets to Watson just ran incredibly cold in 2023.
Watson himself believes he has addressed the root cause of his recurring hamstring injuries by strengthening his weaker leg to achieve greater symmetry in muscle mass. We incorrectly ignored a similar narrative about Alvin Kamara’s muscle symmetry last offseason, causing us to miss out on a 17% year-over-year increase in weighted opportunity per game and a 21% increase in FPG.
As a rookie (with a QB who performed worse than Love overall), Watson led all WRs in fantasy points per route and ranked top-10 in yards per route run (YPRR) among all rookies over the past decade.
Watson earns more valuable targets than almost any other WR in the league.
Overall, you’re opting into a wide range of outcomes by drafting Watson. However, he’s currently priced as if last year’s low-end outcome is his median, with the community pretending his rookie season never happened. I’ll sign up for that value proposition every day of the week.
2022 WR Class by Career FPG
— Scott Barrett (@ScottBarrettDFB) May 23, 2024
+ in games with a route share >60%
1. Christian Watson (15.4) [ADP WR47]
2. Chris Olave (13.7) [WR12]
3. Garrett Wilson (13.2) [WR8]
4. George Pickens (11.0) [WR28]
5. Drake London (10.8) [WR10]
DeAndre Hopkins, WR, Tennessee Titans
2023 Catchable Target Rate: 8th-worst, 2023 FPG Rank: WR29, 2024 ADP: WR43
Hopkins ranked within the top 20 most unlucky WRs by depth-adjusted catchable target rate.
Hopkins’ catchable deep target rate ranked 11th-worst, contributing to his losing 2.66 XFP/G to uncatchable deep targets (2nd-most).
Despite that bad luck, Hopkins finished top 10 in target share, air yards share, and end zone targets, as well as top 20 in both targets per route run (TPRR) and first downs per route run (1D/RR).
In games with Will Levis, Hopkins ranked 8th in XFP/RR (0.54) and tied for 13th in FP/RR (0.54). These are excellent marks in highly predictive metrics that often coincide with elite fantasy football scorers.
So long as a stat wasn’t directly related to his team’s raw pass volume, Hopkins performed very well in it.
DeAndre Hopkins, 2023:@FantasyPtsData
— Ryan Heath (@RyanJ_Heath) June 2, 2024
Target Share: 26.9% (10th-best)
End Zone Targets: 14 (10th)
Air Yards Share: 43.6% (4th)
Targets per Route Run: 0.29 (10th)
First Downs per Route Run: .103 (21st)
Yards per Route Run: 2.27 (18th)
Fantasy Points/Game: WR29
2024 ADP: WR45 pic.twitter.com/R9Q4I5t59V
However, this didn’t perfectly translate into fantasy points because former HC Mike Vrabel was so stubbornly run-heavy. The Titans ranked 5th-worst in PROE (-3.2%) and dead-last in catchable targets per game.
New HC Brian Callahan (whose offenses have ranked top-10 in PROE each of the past three seasons) seems overwhelmingly likely to turn this around. (The Titans choosing not to re-sign Derrick Henry obviously points to that.) Regardless of the regression argument, Hopkins should see more catchable targets this year through sheer team pass volume.
Hopkins’ age might be a concern if his cost were higher, but he finished as a top-24 WR by FPG in every season from 2017 to 2022 until he encountered the run-run-pass (or run-run-run) buzzsaw that was the 2023 Titans offense.
You can currently make an incredibly cheap, high-upside bet that Hopkins’ scoring decline was related to environment rather than age, a stance his peripherals (including his 2.27 YPRR, his best mark of the past three seasons) back up. Sign me up for this.
Amari Cooper, WR, Cleveland Browns
2023 Catchable Target Rate: 10th-worst, 2023 FPG Rank: WR17, 2024 ADP: WR29
Cooper averaged 2.27 XFP/G lost to uncatchable deep targets (7th-most). But that only mattered for part of the season…
In six games with Dorian Thompson-Robinson and P.J. Walker at QB, Cooper averaged a 63.0% catchable target rate (2nd-worst) and just 7.9 FPG.
Outside of those games, he averaged 20.1 FPG, which would have ranked 6th-best among all WRs.
Amari Cooper in 2023
— Ryan Heath (@RyanJ_Heath) March 6, 2024
[Catchable Target Rate / YPRR by QB]
Deshaun Watson: 76.3% / 2.96 (5th-best)
Joe Flacco: 71.4% / 3.54 (2nd-best)
P.J. Walker, Jeff Driskel, and Dorian Thompson-Robinson: 63.0% / 1.37 (62nd)
Cooper is an elite WR1 with anything approaching normal QB play.
Even in Deshaun Watson’s five starts (removing some of the insane pass volume provided by Joe Flacco), Cooper averaged 17.6 FPG, which would have tied him with Puka Nacua as the overall WR6.
Cooper's only change is the addition of Jerry Jeudy, who has not commanded even a 20% target share (~WR36) since his rookie season.
Even if Watson gets injured again, the Browns’ QB2 is now Jameis Winston, who has historically been just as happy as Flacco to chuck the ball downfield.
Cooper presents a rare opportunity — so long as his contract situation is cleared up within the next several weeks — to get access to legitimate top-10 upside as late as he’s going.
Diontae Johnson, WR, Carolina Panthers
2023 Catchable Target Rate: 11th-worst, 2023 FPG Rank: WR40, 2024 ADP: WR44
Johnson was even more unlucky in 2023 than you might think at first glance; his depth-adjusted catchable target rate ranked 8th-worst.
For Johnson’s game specifically, intermediate depth (10-19 yards) is the most important, as those are the targets he relies on the most.
On those intermediate throws, he averaged the most yards per catchable target in the NFL.
But he was saddled with the worst catchable intermediate target rate among all qualifying WRs:
Diontae Johnson OWNS the intermediate area of the field (10-19 yards).
— Ryan Heath (@RyanJ_Heath) June 11, 2024
But he was hung out to dry there by his QBs last year.
At this depth, he led all WRs in Yards per CATCHABLE Target...
...but received the worst catchable target rate of any WR.
(via @FantasyPtsData) pic.twitter.com/gcR0nLzckI
Notice in the chart above that despite Bryce Young’s historically poor rookie season, he was plenty capable of delivering catchable targets to his receivers between 10-19 yards downfield.
Additionally, new Panthers HC Dave Canales has squeezed around 25.0 catchable targets per game out of Geno Smith and Baker Mayfield over the past two years — about league-average in most seasons. It’s hard to overstate how impressive Canales’ recent resume is.
Just some notable finishes in Adjusted Net Yards per Attempt*:
— Ryan Heath (@RyanJ_Heath) June 2, 2024
Geno Smith's career before Seahawks: 4.65
2022 with Dave Canales: 6.54
Baker Mayfield 2022: 4.83
2023 with Dave Canales: 6.47
Bryce Young 2023: 3.68
2024 with Dave Canales: ???
Bryce Young = 🚀@FantasyPtsData
Johnson has ranked top-20 in first-read target share over each of the past three seasons, including a top-10 fantasy finish on 17.3 FPG in 2021 (the last time he had better than bottom-five QB play).
Despite that abjectly horrible QB play, he just posted career-best marks in virtually every efficiency stat.
And he leads all WRs in ESPN Open Score over the past five seasons — he is the best separator in the league.
Johnson may no longer have a top-12 ceiling (unless Young turns out to be far better than mediocre), but he can still patch up the WR position for just about any fantasy roster cost-effectively. He’s a priority middle-round target for me.
Kyle Pitts, TE, Atlanta Falcons
2023 Catchable Target Rate: Worst among 34 TEs, 2023 FPG Rank: TE17, 2024 ADP: TE6
I intended to focus primarily on the WR position, but it’s impossible to discuss catchable targets without talking about Pitts.
Under Arthur Smith, the Falcons operated one of the most hostile offenses to receiving production in recent memory — the team averaged the second-fewest catchable targets per game over the past two seasons (20.0).
Meanwhile, the Minnesota Vikings under new Falcons QB Kirk Cousins averaged the 2nd-most over that span (30.1), a whopping +50% difference in catchable targets.
Seriously, read that again: the Vikings passing game has been 50% more hospitable to fantasy production than the Falcons over the past two years.
This fact has been thoroughly priced into Drake London’s ADP (WR10), but for some reason, not Pitts'.
Interesting data point here:
— Sigmund Bloom (@SigmundBloom) June 6, 2024
FF community is so excited about what change in ATL will do for Drake London's value that he has gone from a 4th/5th round pick last year to a 2nd round pick this year.
Pitts was was a 6th round pick last year... and is a 6th round pick this year https://t.co/HbsbK703kZ
In 2022, Pitts lost a whopping 3.42 XFP/G to uncatchable deep targets, the highest single-season mark of any WR or TE over the past three seasons (min. 8 games). He wasn’t as individually unlucky in 2023 (he had some positive regression), but it didn’t matter due to the team-level pass volume issues discussed above.
Over the past two seasons, Travis Kelce and Mark Andrews are the only TEs to have averaged more expected fantasy points per route run (XFP/RR) than Pitts. In other words, Pitts has earned opportunity (adjusted for fantasy value) at a comparable rate to those players.
This suggests that Pitts has been by far the most unlucky TE in the league and that his ability to command targets is (at worst) on par with that of the best players at the position.
Expected Fantasy Points/Route Leaders
— Ryan Heath (@RyanJ_Heath) June 3, 2024
(TEs, 2022 + 2023, min. 300 routes)
1. Travis Kelce (0.484)
2. Mark Andrews (0.463)
3. Kyle Pitts (0.446)
4. T.J. Hockenson (0.441)
5. Sam LaPorta (0.426) pic.twitter.com/tKlAyR3r7C
Sticking with the comparisons to Cousins’ previous team, if Pitts had run as many routes per game as T.J. Hockenson and scored exactly at expectation (a reasonable assumption given league-average or better QB play), he’d have averaged 14.1 FPG over the past two seasons, 2nd-most at the position behind only Travis Kelce.
Pitts accomplished this despite being hobbled for the entire 2023 season after undergoing MCL and PCL surgery, a more complex injury than was originally reported.
Pitts produced the most receiving yards by any rookie TE since the merger.
Pitts earns downfield targets like no other TE in the league.
New OC Zac Robinson is a Sean McVay disciple from the Shanahan coaching tree, the benefits of which are discussed at length in the team-level section above.
For all of these reasons, I’m convinced Pitts is among the most screaming fantasy values at the TE position we’ve seen in years. Do not let the ghosts of Arthur Smith and Desmond Ridder talk you out of this.


