
You’ve read the articles. You’ve seen the tweets. You’ve heard about an exclusive stat you want access to. Or perhaps a well-informed friend referred you here as a way to take your fantasy football, DFS, or betting skills to the next level.
No matter how you got here, now you know the secret: the Fantasy Points Data Suite is the most valuable and powerful football research tool available on the internet. I’ve spent hundreds of hours squeezing every possible informational edge out of this product. Even if you’ve never touched an R script, an Excel sheet, or a computer, don't worry; I’m here to give you a tutorial on pulling the dankest stats to help you win your leagues and your online arguments. (It’s definitely easier than an Excel sheet).
We’ll start with the basic tables — which only require a free account and populate within minutes of each game ending — and work our way up to the good stuff. You’ll be researching like a pro in no time.
This article is structured as a sequential tutorial, but feel free to skim through the section headers if you’re looking for something in particular. (If you’re already a pro at using the Data Suite and are mostly here for interesting stats and my analysis, I’d skip down to the “Filters” section).
You can access each table from the Data Suite Dashboard once signed in or from the navigation bar at the top of every table.
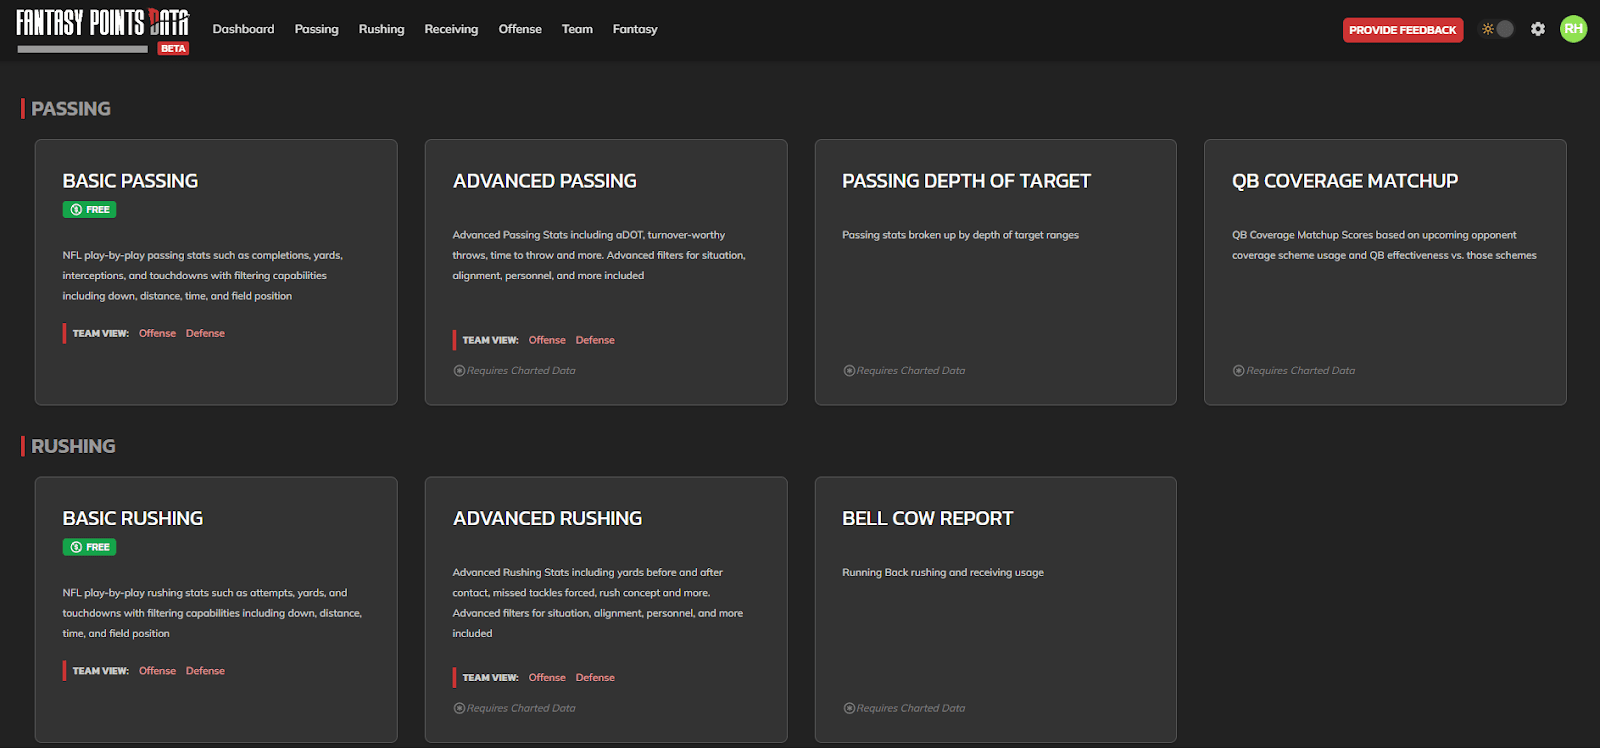
Once you’ve made an account or signed in, the dashboard is your home base, providing a description of every table available in the Data Suite.
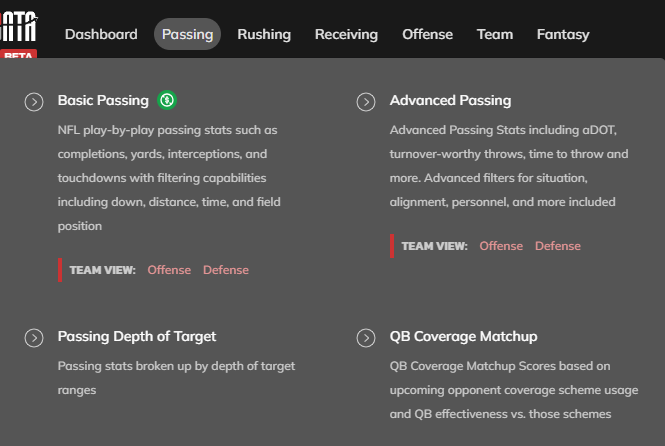
Wherever you are in the Data Suite, you can always change tables via the navigation menu at the top. Just click the table name to see the listed information by player, or click the red “Offense” and “Defense” options for team views where applicable! Offense and Defense views can also be accessed with the buttons at the top-right of each table.
Basic Navigation and Sorting (Start Here If You’ve Never Used the Data Suite Before)
Once you load up the Basic Passing table, you should see something like this. There’s a lot going on here, so I’m going to explain every knob and lever one by one.
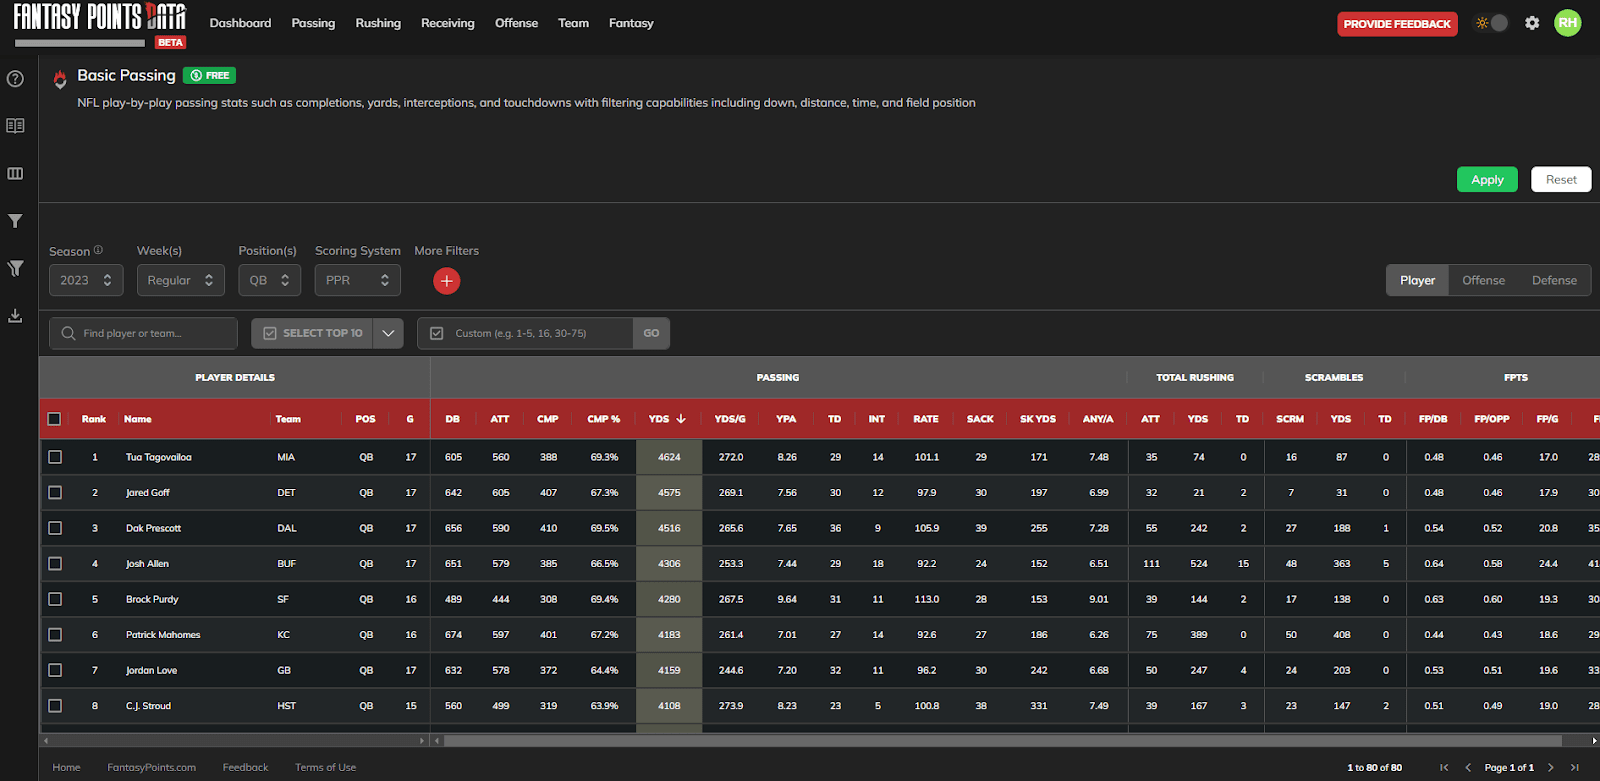
You should be able to scroll up and down the page as normal to see more rows of players. Depending on the table and your screen size, you may also need to scroll left and right using the horizontal bar at the bottom of the page to see every column (each containing a different stat).
If you see a stat label along the top that you don’t understand, don’t worry: you can always hover over the stat name with your cursor to reveal a full explanation. Clicking on the book icon on the left sidebar will also reveal a full glossary.
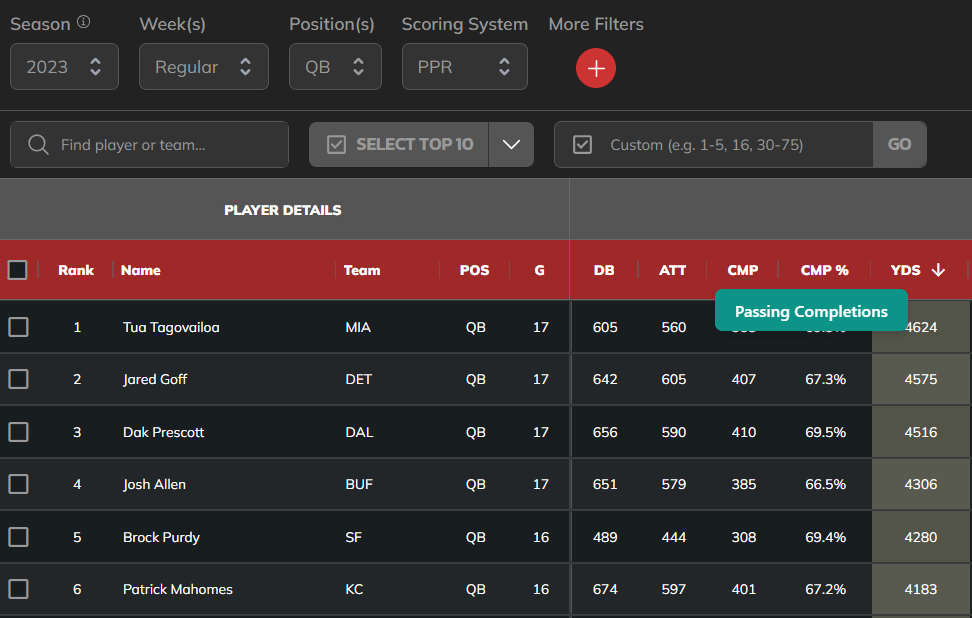
”CMP” stands for passing completions. It looks like Dak Prescott had 410 completions in 2023.
We can tell this table is currently sorted by YDS (passing yards) since that column is highlighted. The downward-facing arrow tells us it’s in descending order. We can change that by clicking on “YDS” to change to ascending order, or by clicking on another column label to sort by a different stat.
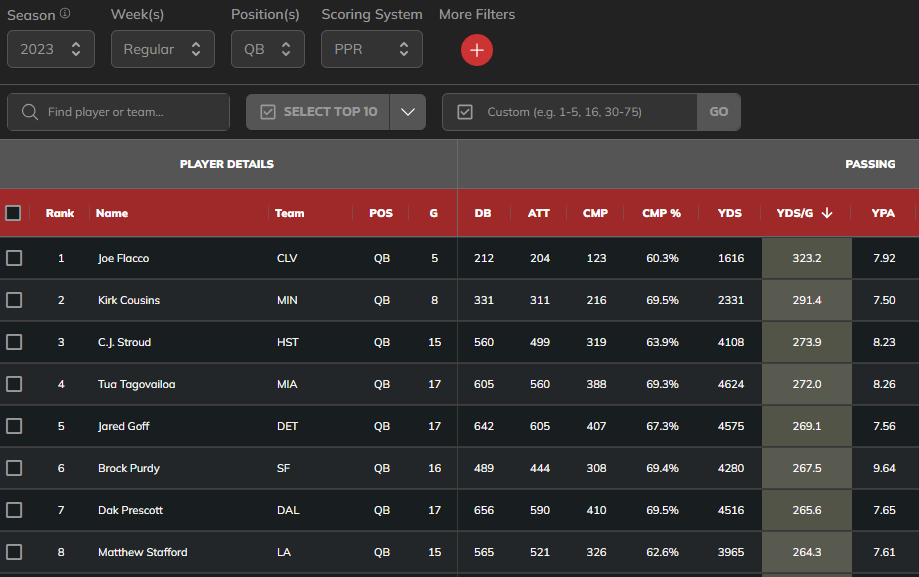
I’ve clicked on YDS/G (passing yards per game) to sort by that, instead. Joe Flacco led all QBs in this stat last year — pretty elite.
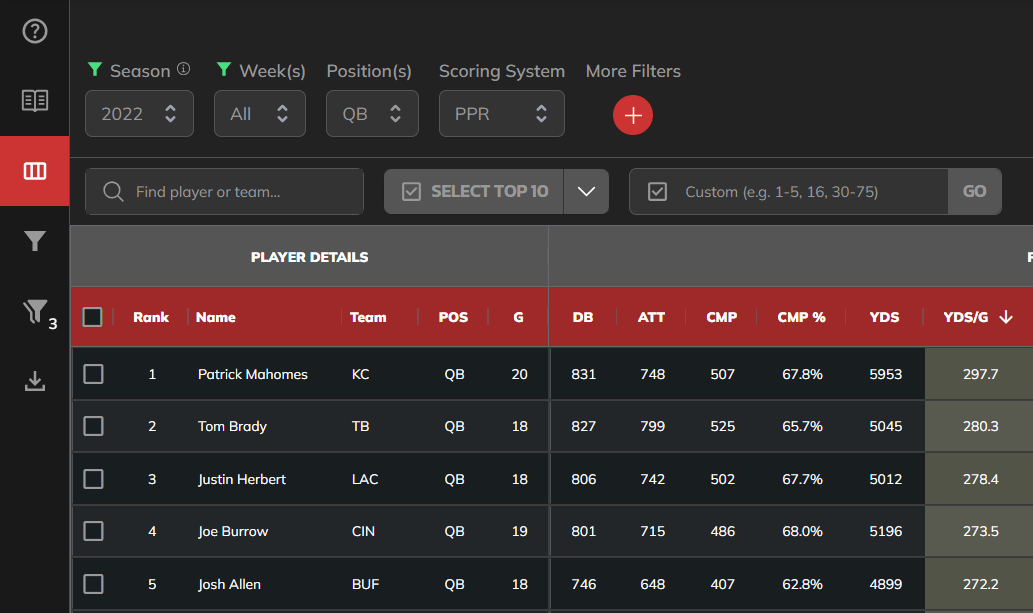
But if we want to see who led the NFL in YDS/G in 2022 (the previous season) and including playoffs, we can quickly get that information with the default filters located above the table. We can change the season from 2023 to 2022, and use the “Week(s)” dropdown to also select playoff weeks.
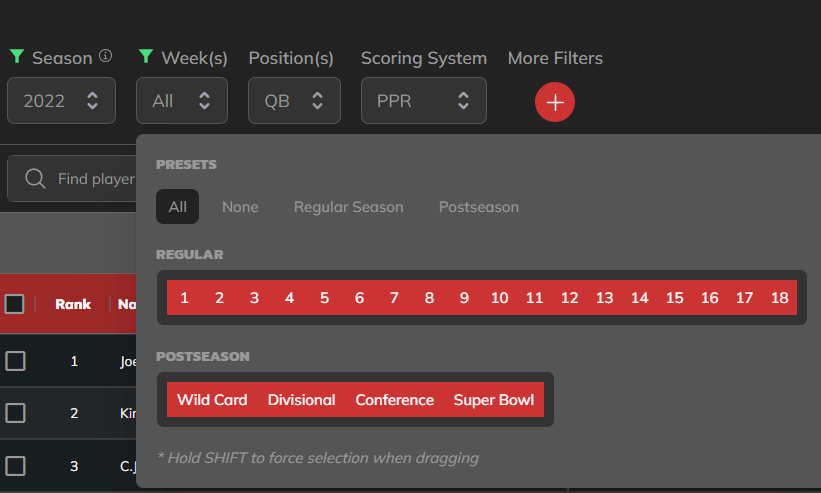
Selecting “All” under presets will highlight every week (including playoffs) in red. You can also select and deselect individual weeks by clicking to toggle each number. The green icons next to “Season” and “Week(s)” indicate we’ve made a selection that is different from the defaults. You can also select different positions and fantasy scoring systems from the other two filters if you desire.
Once we’ve selected all our filters, we must click the big green “Apply” button in the top right to get the table to update. Do this every time you make any changes to what you want to see in the table.
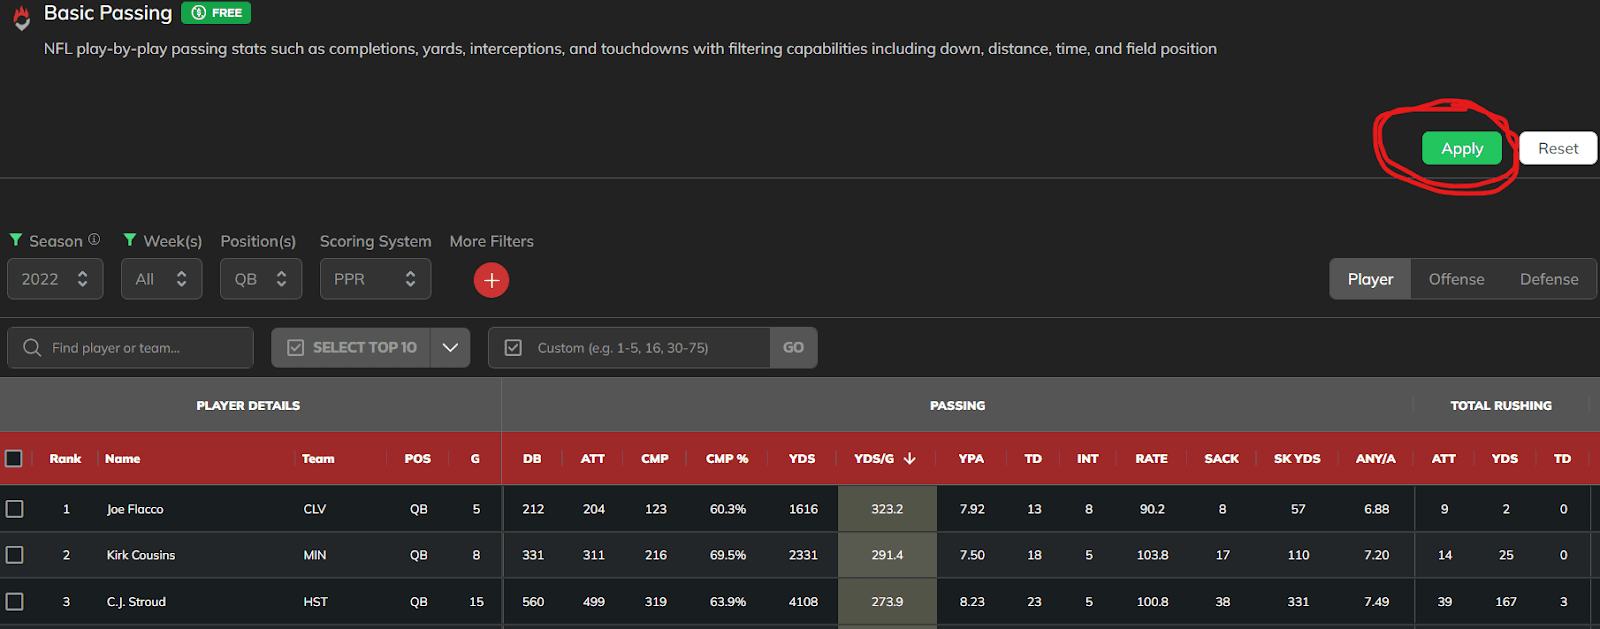
Always click the green button to update the table. If you want to quickly remove all changes you’ve made, hit the white “Reset” button next to it instead.
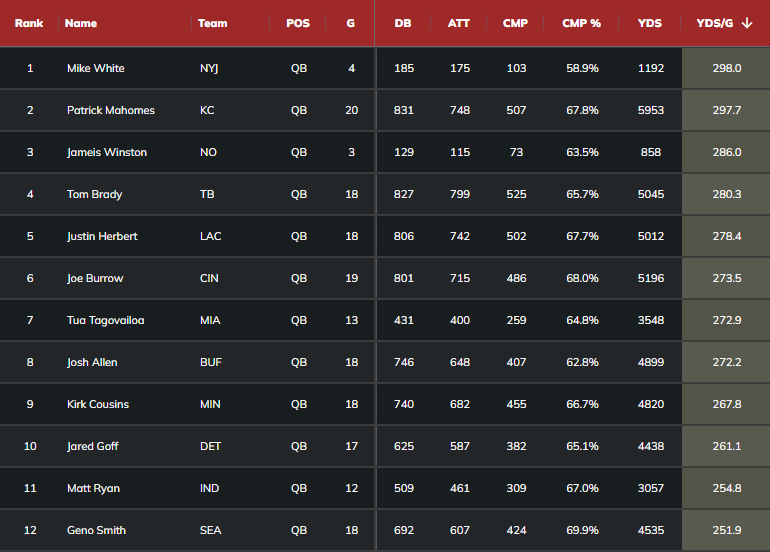
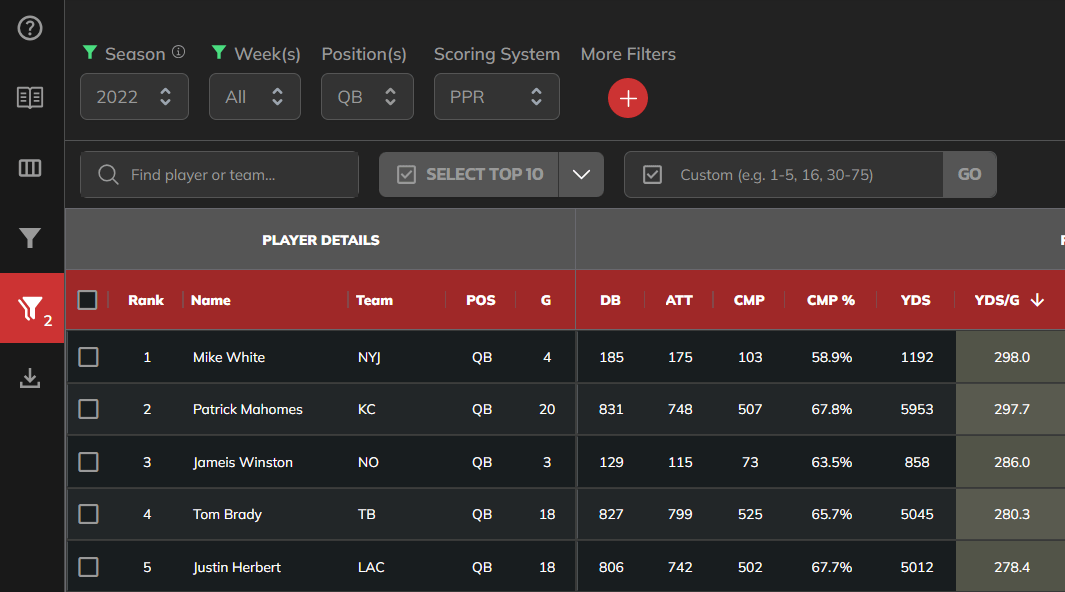
With our changes applied, we can see that Mike White (our king) led the NFL in passing yards per game in 2022, including playoffs.
Setting Minimum Game Thresholds
But as you can see above, that was because White played in only four games — what if we want a top-10 among players who played at least 16 games?
Start by clicking the advanced filter button on the left sidebar, which I’ve highlighted in red in the above screenshot.
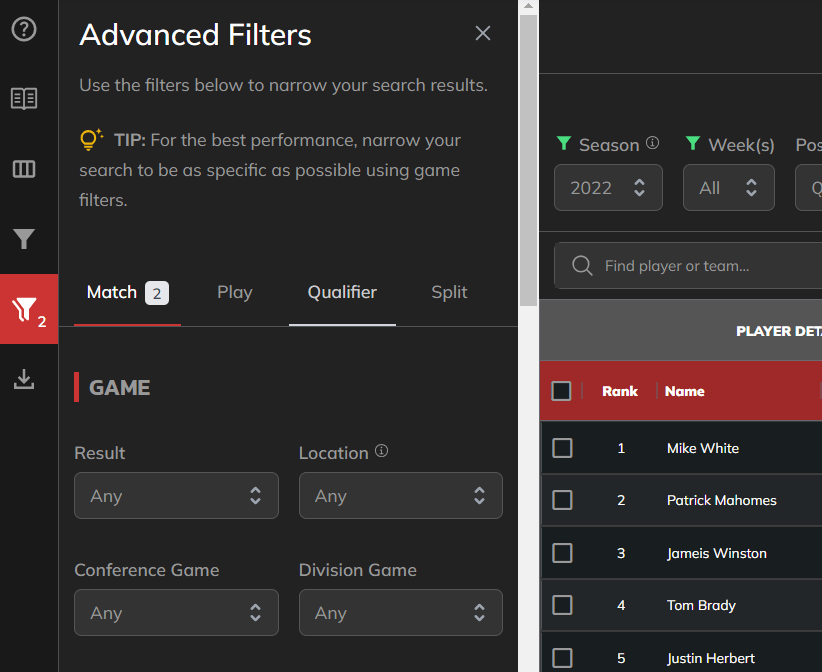
This will open the Advanced Filters menu. Currently, we’re in the “Match” tab. You could scroll through from here to check out some of the available filters, but since we’re looking to set a games played minimum, let’s instead click on the “Qualifier” tab.
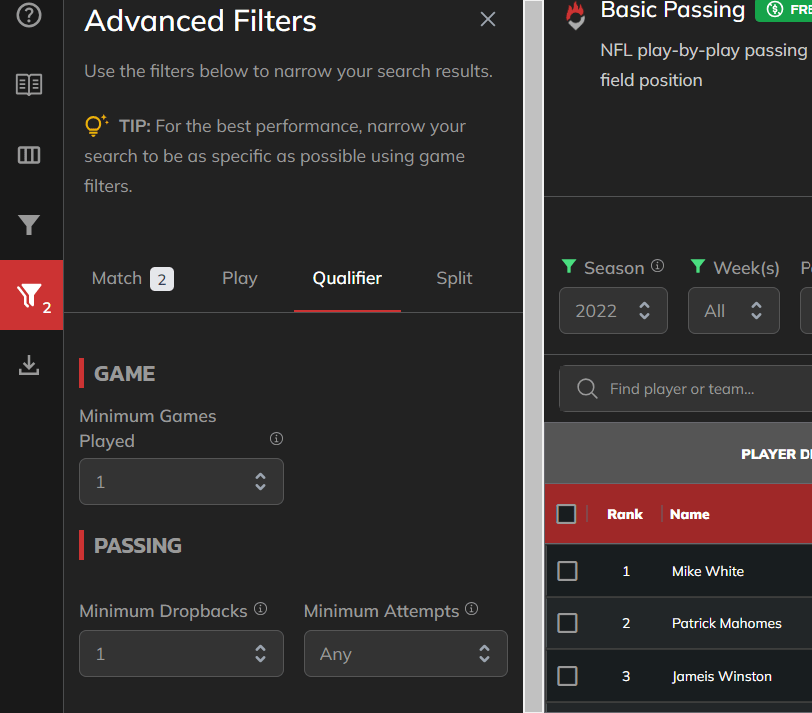
Minimum Games Played is our first option here. Expand the drop-down.
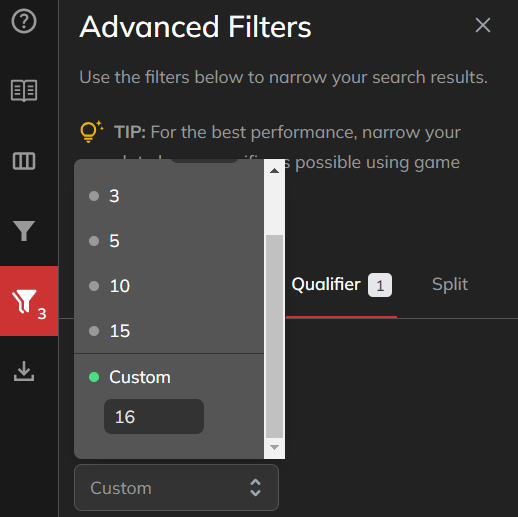
We could filter by any of the preset game thresholds, or scroll down to enter our own custom number of games.
Finally, remember to click the green apply button in the top right again. Then, the table will update to reflect our new 16-game minimum. You can also set minimum dropback, pass attempts, completions, and touchdown thresholds, as well as carries, targets, receptions, routes, and touches once we get to our rushing and receiving tables. If you’re ever sorting by a stat and a lot of players you’ve never heard of who hardly see the field are at the top, setting some sort of minimum is usually a good first step.
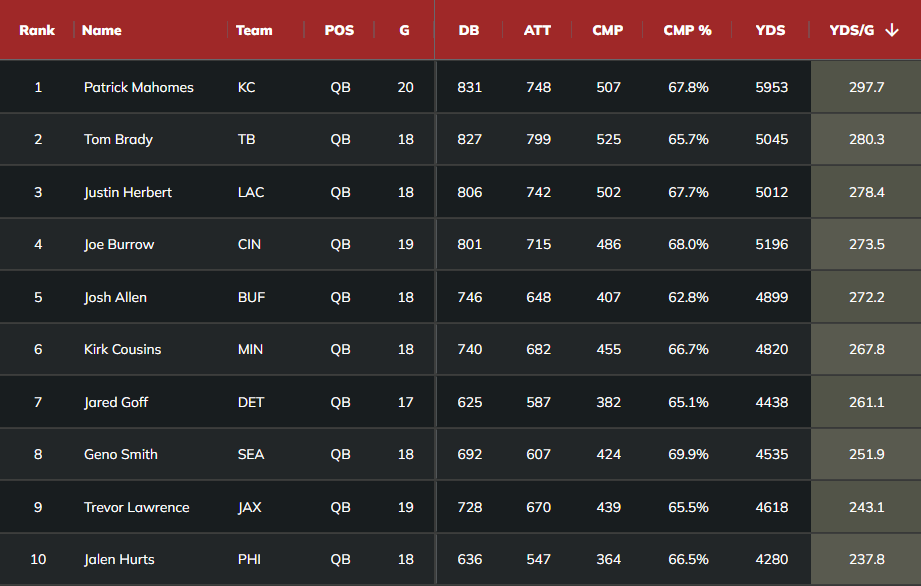
Now that we’ve updated the table to reflect our 16-game minimum, here are the top-10 QBs by passing yards per game in 2022, including playoffs.
Hiding Columns
If we want to remove some of the extra columns to make a better screenshot (or make your view of some of the larger tables less overwhelming), we can do that as well. I use this throughout the rest of the article.
Select the columns button on the left sidebar, highlighted in red in the screenshot above.
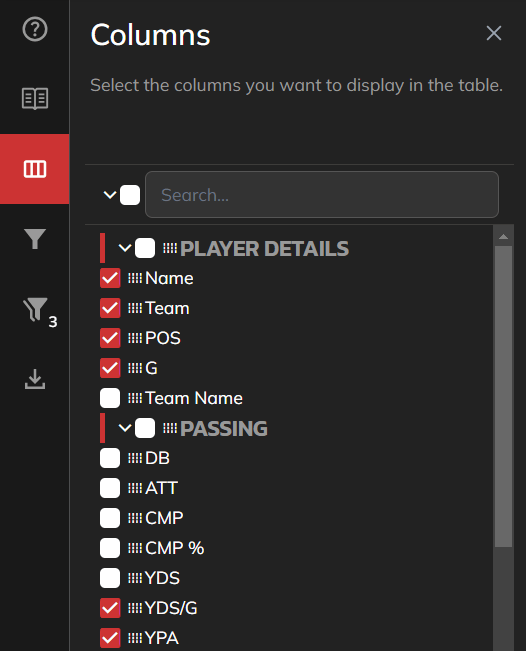
This will bring out the columns menu, where we can select and unselect stats to remove them from the displayed table. Here, I’ve unselected DB, ATT, CMP, CMP%, and YDS. You can toggle whatever columns you’d like, and can always come back here or refresh the page to get them to reappear.
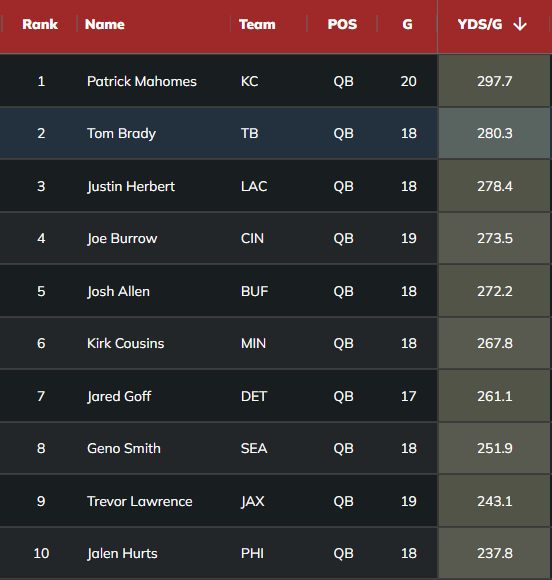
Now YDS/G is the first column that displays after the number of games. Hiding columns you don’t need can also be useful for navigating the larger tables if you know you’re looking for something specific.
Creating Splits
What if we wanted to know who had the most passing yards in any individual game last year? Start by re-adding the “YDS” column and changing the year back to 2023, as covered above. Then, open up the advanced filters again on the left sidebar, but this time, click on the “Split” tab.
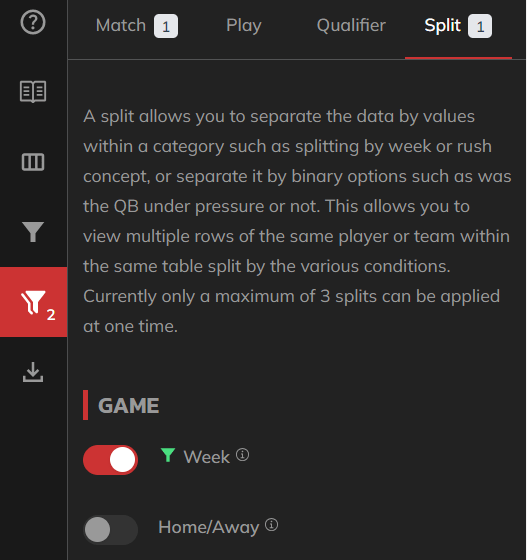
The first option here is the week split. Toggle it on as I’ve done above, then hit the green “Apply” button to update your table.
Once you do all of this and sort by YDS, you should be able to see that C.J. Stroud had the best single-week passing yardage performance last year, posting 470 yards in Week 9.
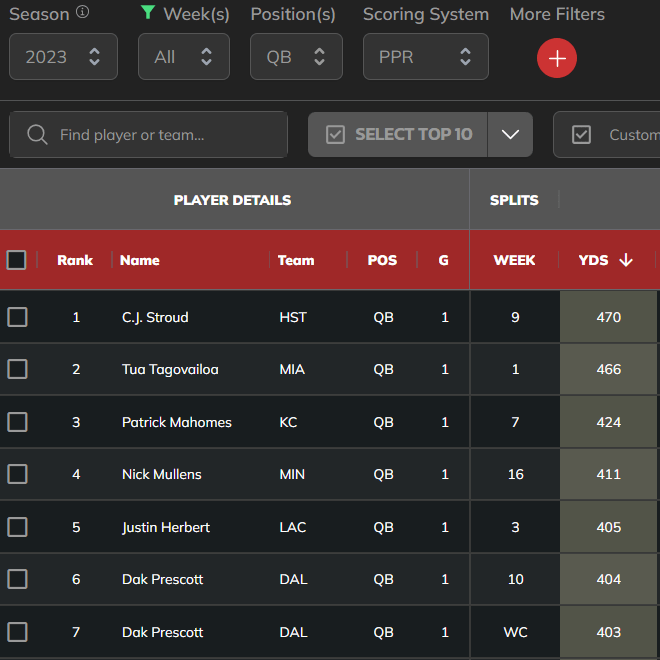
Turning on and applying the weekly split function automatically adds a column telling you which week the player recorded the stats in that row. It looks like Dak Prescott’s Wildcard performance featured the most passing yards in a 2023 playoff game.
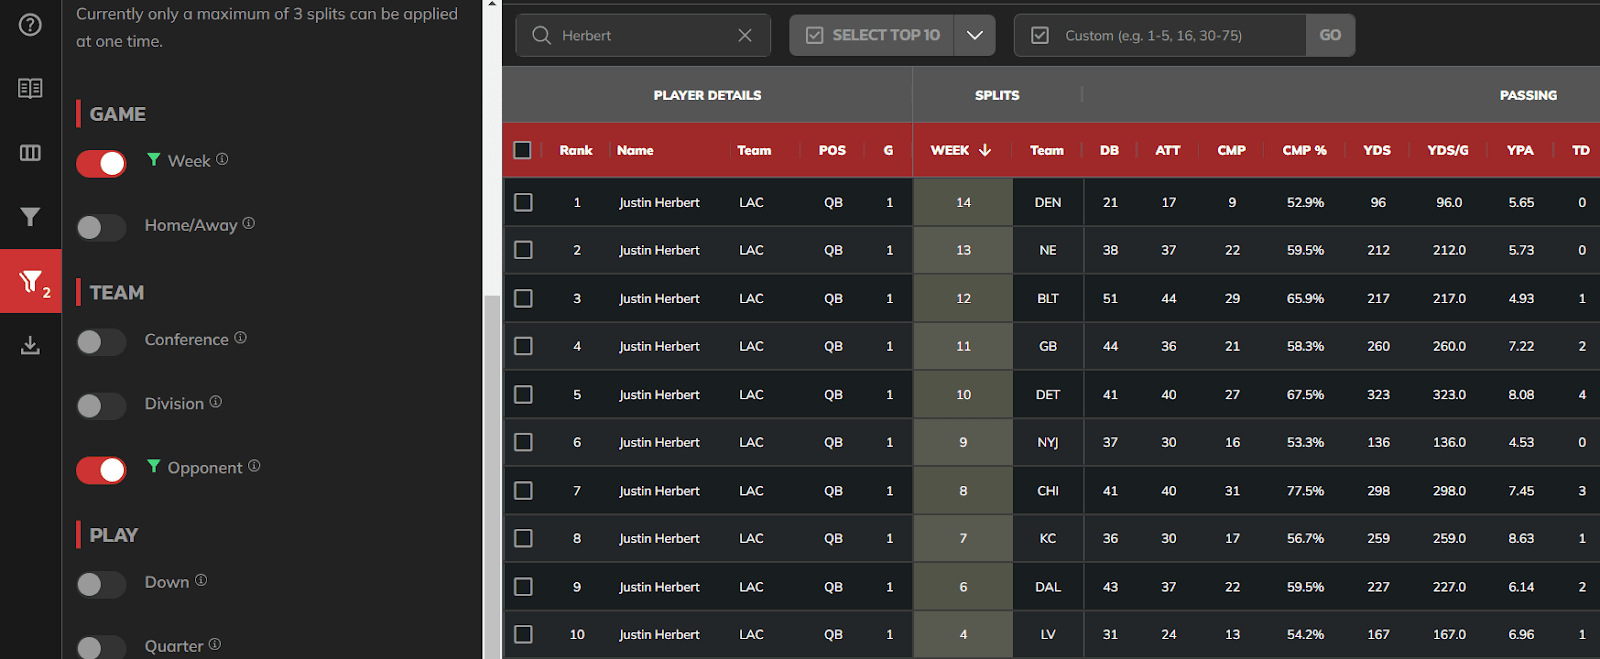
Final pro tip: if you split by both week and opponent, then type a player’s name into the search bar directly above the table, you’ll have created a game log for that player that can display every stat in the Data Suite.
Filters (The Good Stuff)
It’s time to properly dive into filters. If you can conceive of a situation in football, the Data Suite can filter for it. Wins, losses, game location, points scored, date, and weather? No problem. Time on the clock? Down and distance to the goal line? Whether the player’s team is leading or trailing on a specific play? We’ve got that too. You can also combine filters for even more power — looking inside the last four minutes of the game on the road and against divisional opponents is entirely possible.
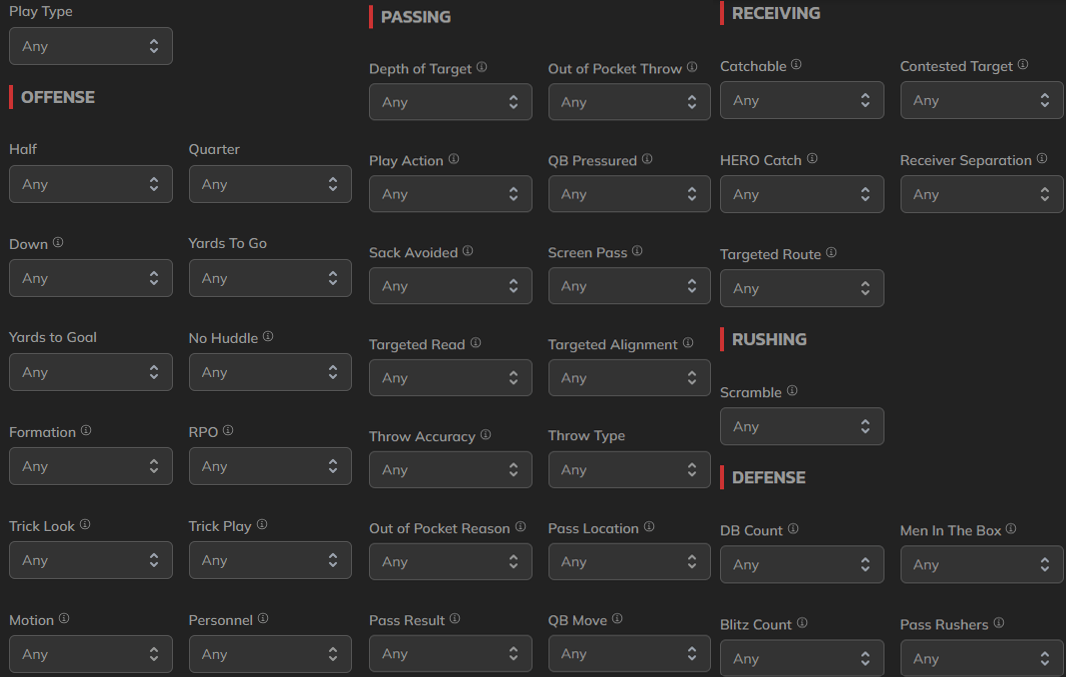
In the more advanced tables, we’ll even be able to filter by target depth, throw accuracy, route type, whether the QB was pressured, whether the targeted receiver got separation, whether the QB targeted his first or second read, catchable targets, defensive coverages, and so much more. While we’ll take advantage of a few of these filters in this tutorial, the above list and the below screenshot provide a glaringly incomplete preview of what the entire Data Suite has to offer.
Staying in the Basic Passing table, let’s start with an interesting observation I made about young QBs. If you’ve been following along with the previous sections, you’ll need to hit the white “Reset” button in the top right. Next, move over to the “Match” tab and scroll down to locate the “Favorite/Underdog” filter.
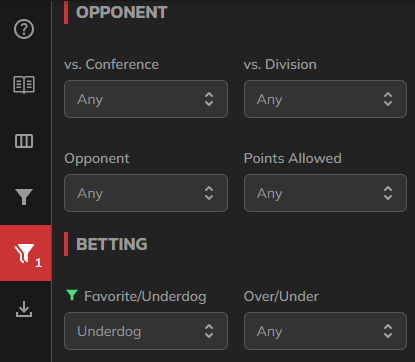
Set the filter to Underdog. Note that we can also filter by the over/under entering each game.
While we’re here, let’s also set the minimum games played threshold in the Qualifier tab to 3 games (as we covered above).
Finally, hit the green “Apply” button in the top-right to make the table reflect all the changes we’ve made, then sort by FP/G over on the far-right side of the table.
We’re left with the Fantasy Points per Game leaders while the QB’s team was a betting underdog in 2023. Many people lean into betting odds and target QBs on favored teams when streaming QBs during the season, so let’s see if we can spot any strategic implications.
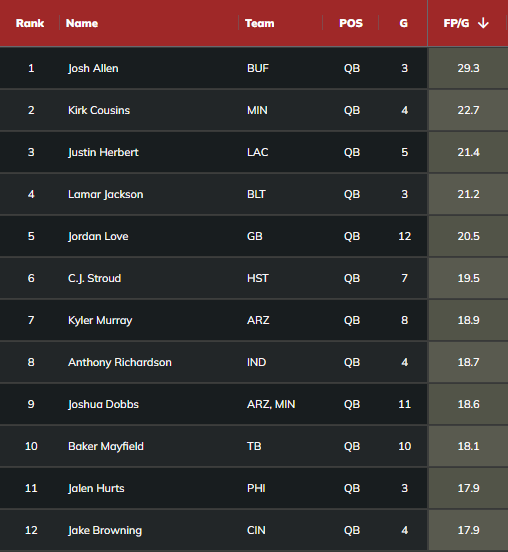
How can you score fantasy points as an underdog? There seem to be two paths: being a good and/or mobile QB who is pressured to score tons of points while trailing in games (Allen, Herbert, Jackson, etc.), or being a first-year starter who surpasses Vegas’ expectations (Love, Stroud, Richardson, Browning). It’s especially noticeable that Love and Stroud were underdogs so frequently as they developed from streamers into bonafide top-12 fantasy QBs.
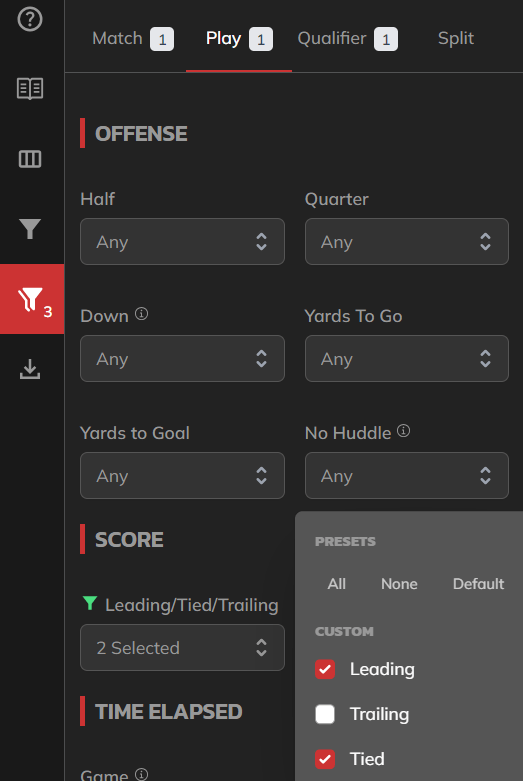
Maybe there’s something to targeting first-year starters who show promise when streaming QBs weekly, even if their team is not favored — as Vegas may be slow to catch on. Let’s add another filter to test this theory. In the Play tab of the Advanced Filters menu, scroll down to the “Leading/Tied/Trailing” filter, and unselect “Trailing.”
Once you click “Apply”, this will filter out all plays where the QB’s team was trailing from the table. We’re left with production from when the QB’s team entered the game as an underdog, but on individual plays where the QB was playing from ahead or while tied — in other words, these QBs scored a lot of fantasy points when betting markets underestimated them.
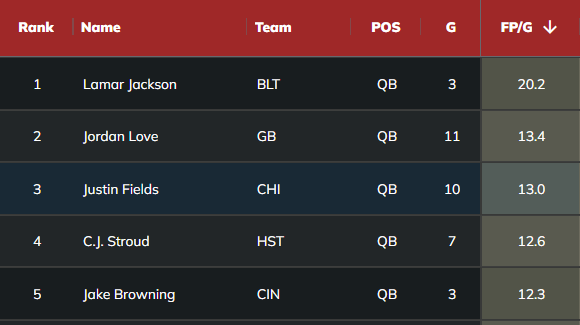
As we predicted, Love, Stroud, and Browning make up 3 of the top-5. This suggests — moreso than other QBs — they and their offenses performed well when betting odds expected their teams to lose. Their production was not as reliant on chasing opponents from behind. I lay out my full thoughts on the implications of this finding for QB streaming strategy in this thread, but in short: don’t be afraid to stream young, unproven QBs who have flashed upside just because they are a betting underdog.
Let’s check out one other filter that has shown surprising predictive power. First, hit the white “Reset” button in the top-right to reset the table. Then, we’ll screen out small-sample QBs by opening the Advanced Filters menu on the left sidebar, selecting the Qualifier tab, and setting the Minimum Dropbacks to 100.
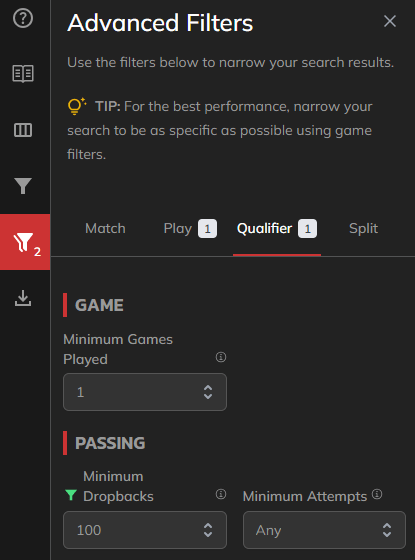
Now for the cool part. Staying in this Advanced Filter menu, navigate over to the “Play” tab, open up the “Down” filter, and unselect 1st and 2nd down.
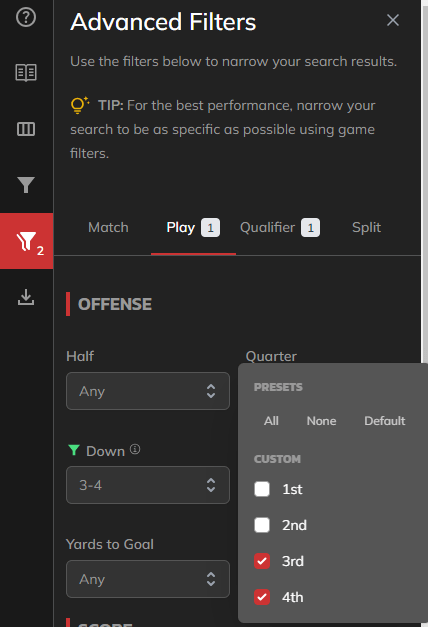
All downs will be checked by default. Uncheck 1st and 2nd, and you’ll see the displayed downs update to 3-4 like above.
Finally, click “Apply”, sort by YPA (yards per pass attempt), and feast your eyes on the most efficient passers on key 3rd and 4th downs.
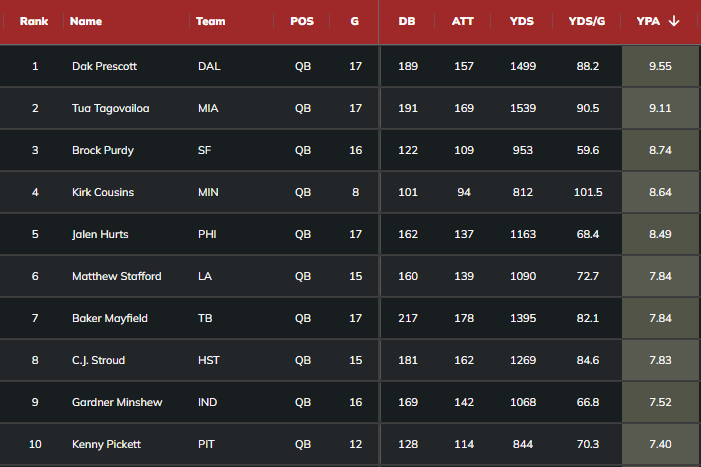
Dak Prescott is criminally underrated. Don’t ask me how Kenny Pickett got here.
It didn’t quite work out for the Cowboys and Dolphins last year, but this exact stat has a recent pattern of identifying teams who make it to the Super Bowl.
Passing YPA Leaders on 3rd Downs
— Scott Barrett (@ScottBarrettDFB) January 11, 2024
[@FantasyPtsData]
2023
1. Cowboys (9.53)
2. Dolphins (9.34)
2022
1. Chiefs (9.85)*
2. Eagles (8.80)*
2021
1. Bengals (9.96)*
2. Rams (9.68)*
*went to Super Bowl
Scott pulled this by team using the “Offense” section of the Data Suite, accessible on the right side above the table and below the “Apply” and “Reset” buttons. We can investigate this trend on the defensive side of the ball by moving over to the “Defense” table.
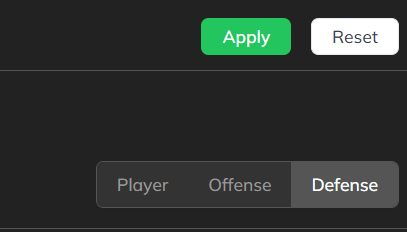
You can toggle between individual players, team offense, and team defense for many of the tables in the Data Suite.
Now that we’re here, let’s add the exact same filter (3rd and 4th downs only) and sort by YPA once again.
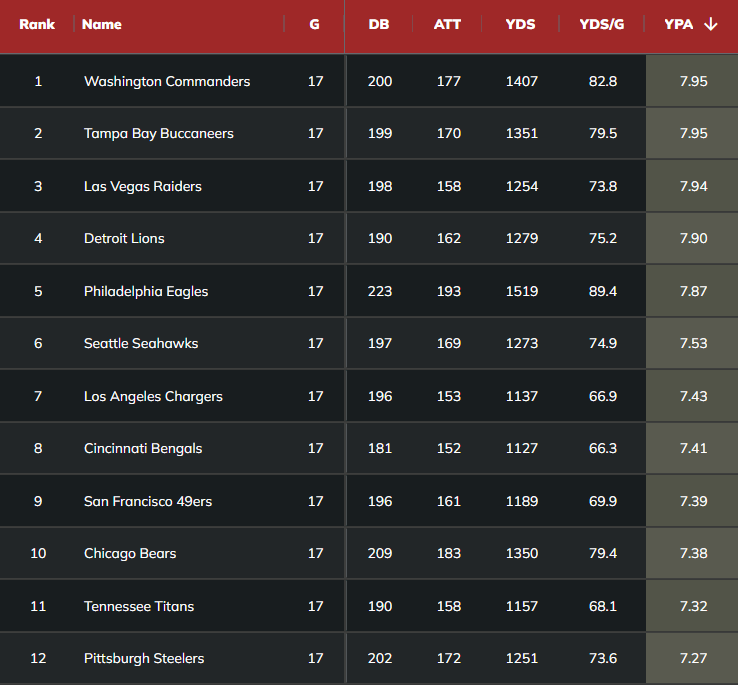
Though some of these teams were rather successful in the Wins column (mostly because a good offense can make up for the flaws of a bad defense in the NFL, much more than the other way around), these were among the best opposing defenses to target in DFS — which you couldn’t quite capture for teams like the Eagles and Seahawks without filtering for 3rd and 4th downs. Over half of Draftkings Milly Maker-winning lineups in 2023 featured a QB facing one of these eight defenses.
Conclusion
You should now have a decent handle on how to navigate the Data Suite, sort by different stats, and apply whatever filters you’d like. This functionality applies to most of the tables in the Data Suite, including the (also free with an account) Basic Rushing and Basic Receiving tables.
Don’t know which stats are important, or where to even start? You should check out my Statistically Significant series, where I dive into the most predictive stats the Data Suite has to offer. We also have an active Discord channel — where you can tag me and any other Fantasy Points contributor directly — to answer any questions you may have along your Data Suite journey. Additionally, I’ll be releasing follow-up pieces to this article throughout the summer covering more advanced uses of the Data Suite in-depth.
That’s all I’ve got for you. Hopefully, this was an instructive exercise that has inspired you to dive into the Data Suite yourself. If you find anything cool, always feel free to tag @FantasyPtsData on X to tell us about it!


